Found this helpful? Share it with peers.
Introduction
Most organizational dashboards are packed with metrics, yet performance problems keep repeating. That’s not a coincidence. The issue is that most of what gets measured only tells you what already happened, by which point intervention is often too late.
Understanding the difference between indicators that warn you early and those that confirm outcomes after the fact is what process performance management is really built on. This blog breaks down the difference between leading and lagging indicators and shows you how designing them together turns measurement into proactive control.
The Comfort of Outcomes
Outcome-based KPIs like revenue, cycle time or SLA compliance have an obvious appeal: they are easy to communicate, executive-friendly and simple to benchmark. It makes sense that dashboards are built around them.
The problem is that they are historical. By the time a KPI reflects a problem, that problem has already happened. Management reviews end up discussing last month’s numbers, and root cause conversations only begin after targets have been missed.
When Is It Already Too Late?
At some point, every KPI becomes actionable. The question is when. And the honest answer is that most organizations find out too late.
There is a meaningful difference between indicators that signal deviation while there is still time to act, and indicators that confirm it after the damage is done. Indicator timing shapes what managers can actually do: late detection narrows the options, early signals expand them.
This distinction is also not new, but it is consistently underestimated in process performance management. And the point is not that one type is better than the other. Effective process performance management needs both, designed together.
What Are Leading Indicators?
Leading indicators signal the likelihood of a future outcome before that outcome materializes. They are predictive by nature, which means they work with probability, not certainty. They cannot guarantee what will happen, but they increase visibility into future risk or opportunity.
That is exactly what makes them valuable for process control. The earlier a deviation is detected, the more options are still on the table: resource reallocation, escalation, reprioritization, or process rerouting. Leading indicators expand that decision window and shift management from reacting to problems toward preventing them.
How Leading Indicators Show Up in Real Processes
Leading indicators are observed while processes are still running, not after they are finished. Therefore they also reflect process behavior, not just results. They often relate to:
- Delays at specific steps
- Unusual repetitions (rework)
- Growing queues or backlogs
- Deviations from the “happy path”
They function as early warning signals of potential failure, but in many cases, they are not obvious until historical analysis reveals their predictive value. Such predictive relationships can become visible through analyses like statistical modelling, process mining, or other data-driven performance evaluation approaches.
Example: Risk of churn during customer onboarding
Let’s assume that a software developer organization has a new customer who participates in the onboarding process.
- Indicator: The customer has not completed key setup steps within the first 5 days.
- Why it is leading: Customers who do not activate core features early are much more likely to cancel later. The incomplete setup does not mean churn has happened, but it signals elevated risk.
Example: Risk of SLA breach during approval workflow
Most organizations have internal approval processes for purchasing requests. Let’s look at a situation with clear signs of a potential failure.
- Indicator: Queue length at a specific approval step exceeds normal range.
- Why it is leading: A growing backlog at a bottleneck predicts extended total cycle time. The SLA is not yet breached, but the probability increases.
Example: Risk of low conversion during a marketing campaign
Let’s imagine that the marketing team of an organization just kicked off a new lead generation campaign.
- Indicator: Email open rate or click-through rate is significantly below the historical average in the first days.
- Why it is leading: Early engagement levels strongly correlate with final conversion performance. Low early engagement suggests the campaign will underperform before the final ROI is visible.
What Are Lagging Indicators?
Lagging indicators measure outcomes after a process has been completed. Unlike leading indicators, they are based on realized results rather than probabilities, which means they provide certainty about what happened, but no warning about what is coming.
Without lagging indicators, organizations have no objective way to assess whether performance targets were actually met. They are the foundation of performance evaluation, target tracking and compliance verification.
How Lagging Indicators Show Up in Real Processes
Lagging indicators are measured after process completion, derived from final timestamps, costs or other realized outcomes. They typically reflect aggregated performance over a period rather than individual case behavior.
They are often tied to strategic goals, such as revenue growth or customer churn rate, and form the backbone of:
- Reporting structures (e.g. monthly reports)
- Executive dashboards
- Strategic reviews (e.g. quarterly business reviews)
- Compliance audits
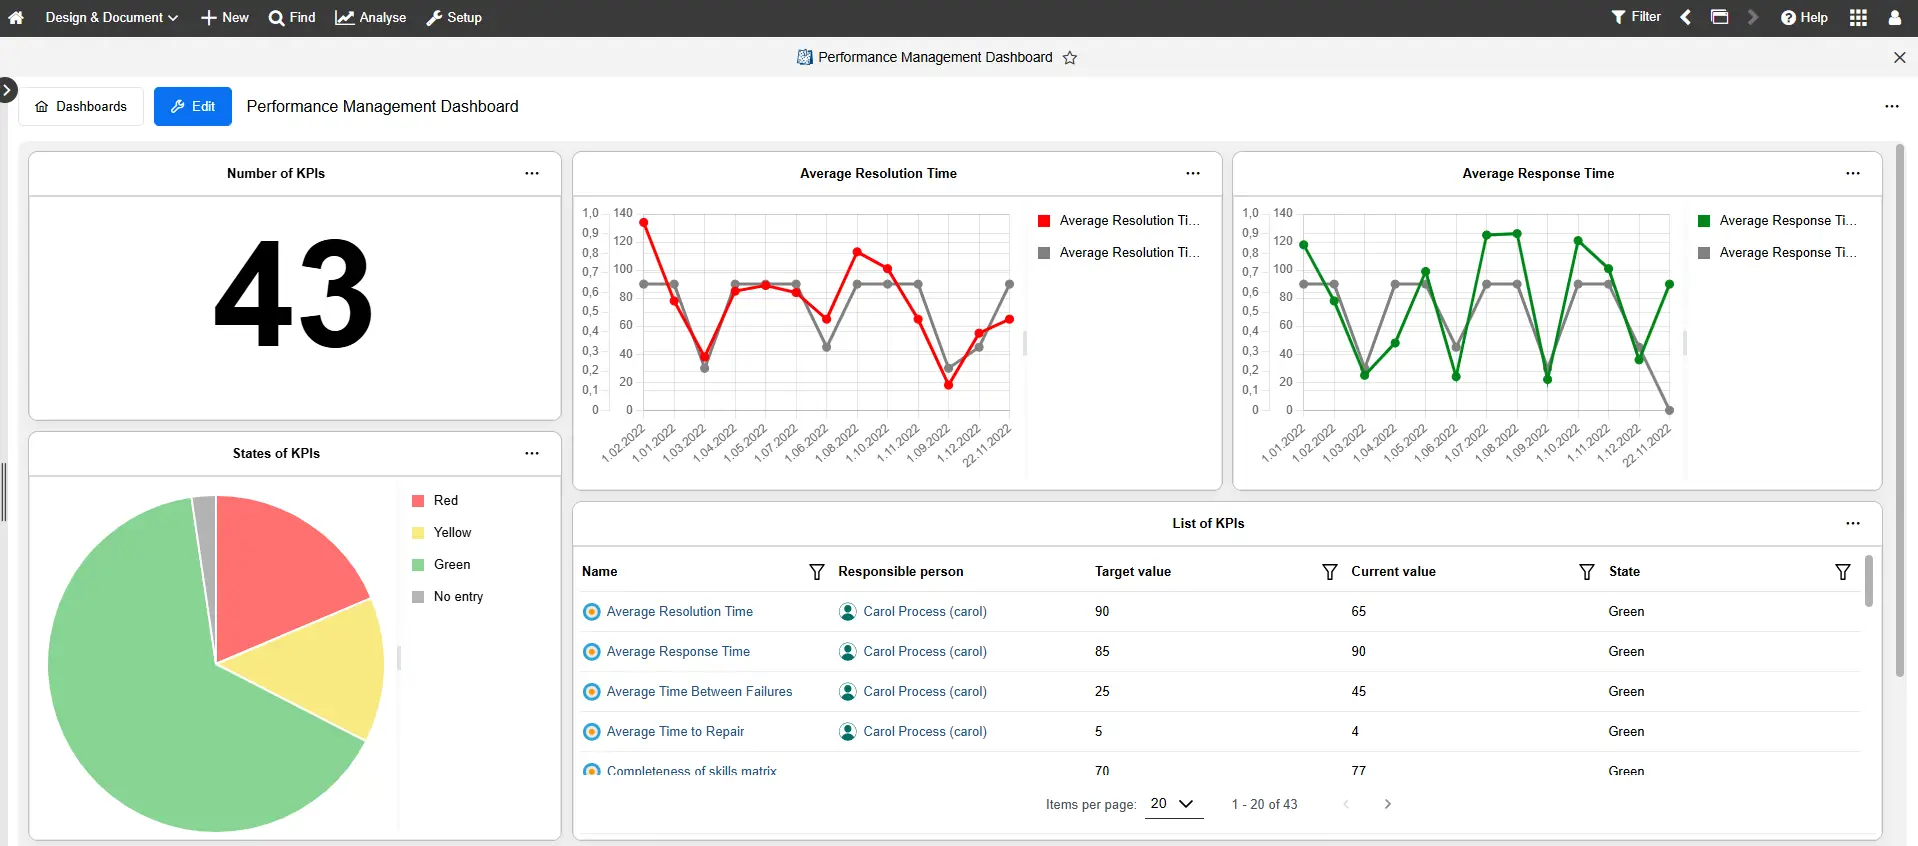
A typical performance management dashboard in ADONIS
Hint: If you would like to create and configure your own dashboard, this is possible with the Dashboards App in ADONIS.
Example: Churn rate after customer onboarding
The previously mentioned software development company can also monitor the onboarding effectiveness and assign an indicator to it.
- Indicator: Monthly churn rate of customers who completed onboarding.
- Why is it lagging: The customer has already left. The metric confirms the outcome but does not prevent churn for those customers.
Example: SLA breach in approval workflow
Let’s imagine that an internal purchase approval process has defined SLA targets.
- Indicator: Percentage of cases that exceeded the 5-day SLA in the last month.
- Why is it lagging: The breach has already occurred. The metric confirms failure but does not allow intervention for those specific cases anymore.
Example: Churn rate after customer onboarding
Let’s assume that the marketing team has completed the lead generation campaign and is now evaluating its performance.
- Indicator: Final conversion rate of the campaign.
- Why is it lagging: The campaign has already finished and the conversions have already happened (or not). The metric confirms the outcome and overall effectiveness, but it does not allow the team to improve this specific campaign anymore, only future ones.
Key Differences Between Leading and Lagging Indicators
| Leading Indicators | Lagging Indicators |
|---|---|
| Predict future outcomes | Measure past results |
| Proactive | Reactive |
| Early warning signals | Performance confirmation |
| Observed during execution | Measured after completion |
| Based on probabilities | Based on realized results |
| Operational focus | Strategic reporting focus |
| Enable intervention | Enable evaluation |
To conclude:
- Leading indicators act as control signals — they steer performance and expand the decision window.
- Lagging indicators act as evaluation signals — they judge performance and close the performance cycle.
They both operate at different but complementary decision layers.
Why Process Performance Needs Both
It is not a matter of “which is better”. Effective process control requires both, but let’s see why.
The Delayed Reaction Problem
Lagging indicators confirm results after impact has occurred, so by the time deviation is visible:
- SLA is already breached.
- Costs are already incurred.
- Customer has already churned.
Without leading indicators, organizations remain reactive and are often focused on explanation instead of prevention. In short, visibility without steering capability limits real control.
The Unvalidated Assumption Problem
As mentioned earlier, leading indicators operate on probabilities, not certainties. Therefore, there is a risk that:
- Organizations optimize signals instead of outcomes.
- False positives drive unnecessary actions.
Without lagging indicators, organizations cannot confirm whether interventions were effective and cannot measure actual impact. In short, prediction without confirmation weakens governance.
Finding Balance between Control and Validation
Leading and lagging indicators together enable a continuous improvement capability and create a closed-loop performance management. A balance between the two should not be accidental, it must be designed during the definition of the KPI architecture.
Designing Leading and Lagging Indicators Together
Indicators should be designed as a system. If we shift our mindset from “which KPIs to display” to “how indicators are logically connected”, we will realize that monitoring is the result of a good design, and not the starting point.
Hint: For a structured approach to defining KPIs, visit our step-by-step guide on how to build a process performance management model.
1. Define What Success Looks Like
Start with the desired business outcome you want to measure. This will be represented by your lagging indicators that ensure alignment with business goals.
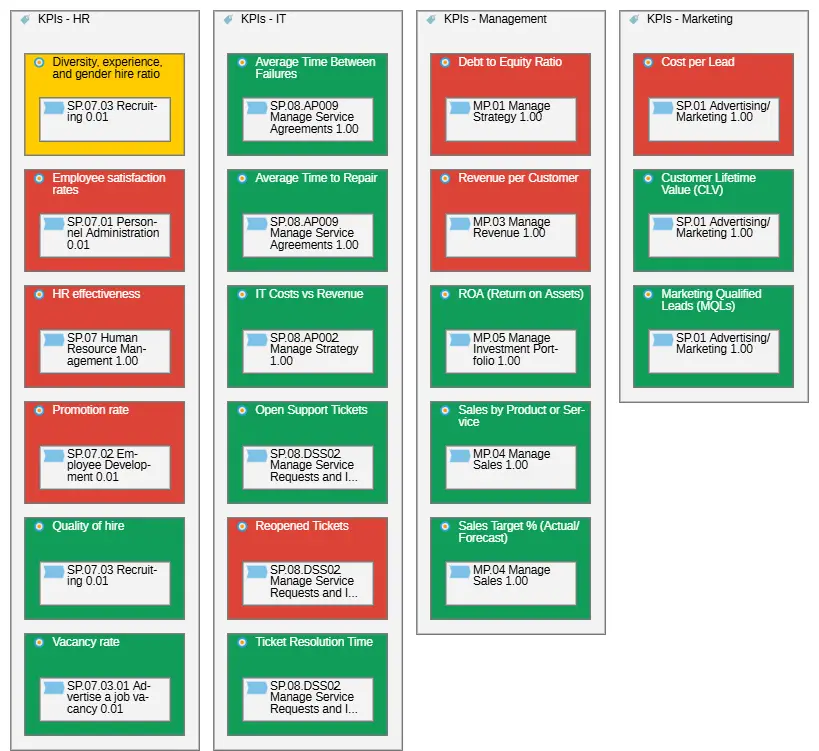
ADONIS makes it easy to define relations between Goals, KPIs and Processes, so indicators can directly be connected to where they occur and alignment between strategy and execution will be ensured.
2. From Outcome to Early Signals
Think about what typically happens before the outcome. Work backwards to identify predictive signals such as patterns or delays. These will become your leading indicators and they should also be linked to the outcome.
3. From Assumption to Evidence
Do not rely only on intuition. Use historical process data to test correlation between leading signals and outcomes, and identify false signals vs. meaningful predictors.
The integrated ADONIS Process Mining solution can process the historical execution data that will enable the validation and refinement of predictive indicators over time.
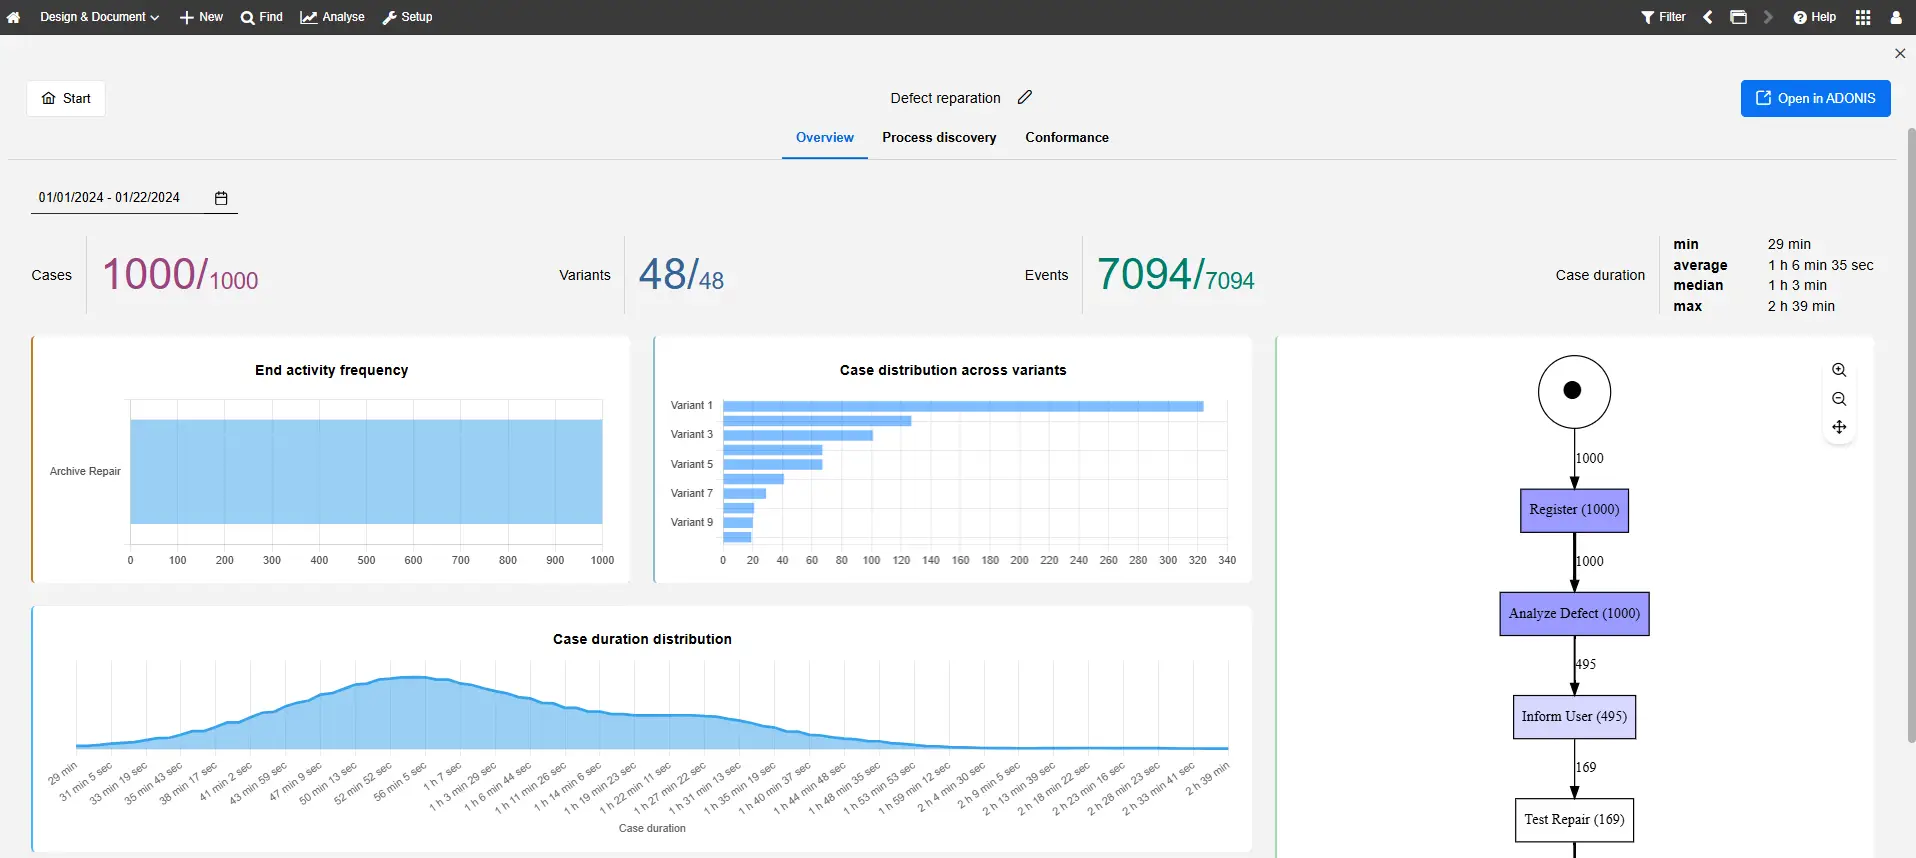
Analyze execution data with ADONIS Process Mining Essentials
4. Define Thresholds and Escalation Logic
A signal alone is not enough. You will need thresholds and clear trigger points to understand when is it “too late” or “at risk”. Besides, it should also be defined what actions should follow and who should be notified. This is where indicators become operational tools, not just metrics.
Threshold-based alerts in ADONIS enable timely intervention
5. Assign Ownership and Responsibility
Every KPI should have a clear owner with its defined responsibilities. It is critical to identify and distinguish the people who monitor, decide and act on the signal. Without ownership, even the good indicators won’t lead to any actions.
The previously mentioned configurable Dashboards in ADONIS can help operationalize ownership by providing the right level of visibility for different stakeholders and enabling monitoring of KPIs.
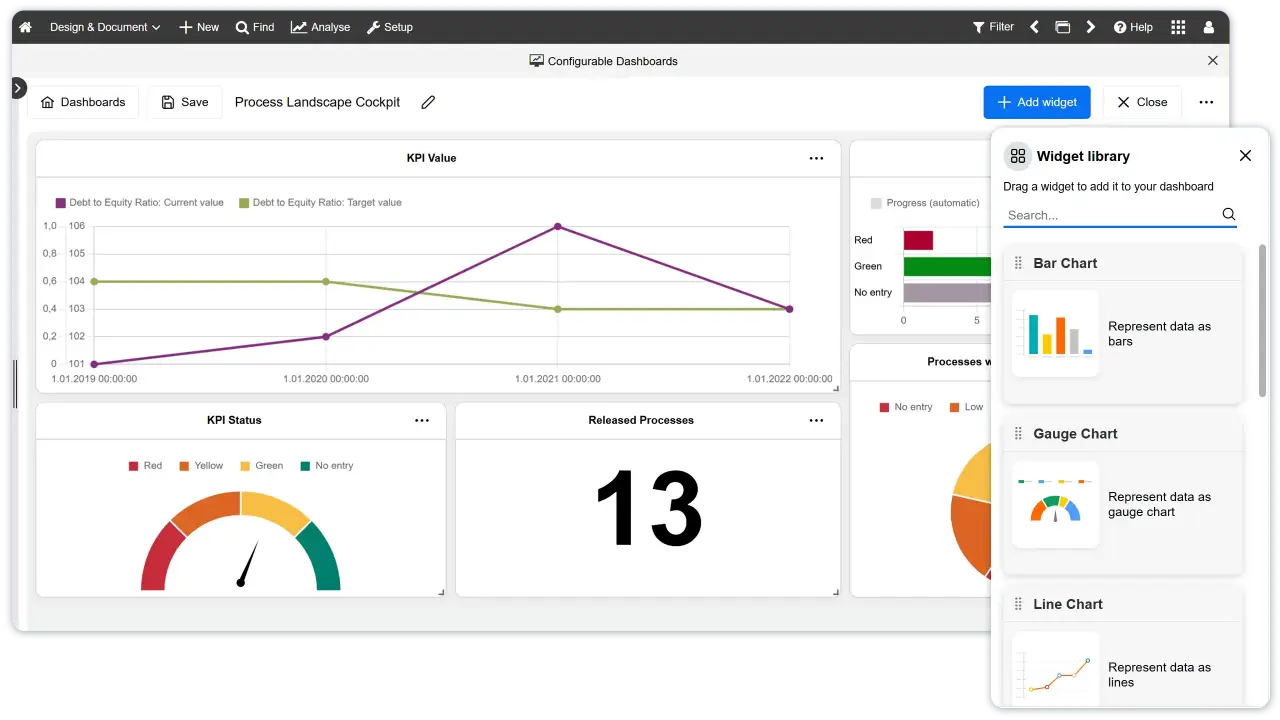
Configurable Dashboards in ADONIS
Hint: See how Process Monitoring provides visibility, control, and continuous improvement in BPM.
From Reactive Reporting to Predictive Process Control
Most performance conversations happen too late because most indicators are designed to confirm, not to warn. Shifting that balance starts with accepting that measurement is a design decision.
Leading and lagging indicators answer different questions at different points in the process cycle. Getting both right, with validated signals, defined thresholds and clear ownership, is what makes the difference between a dashboard that informs and one that sets the direction.
Want to build a performance management model that tells you where things are heading, not just where they went? ADONIS connects indicator design directly to process execution, giving the right visibility to the right people at the right time.


Already got our weekly updates?