Found this helpful? Share it with peers.
Introduction
Processes rarely behave exactly like the diagrams describe them. Teams adapt, systems slow down, new exceptions emerge, and workarounds accumulate over time. Most organizations recognize this intuitively, which is why they invest in dashboards, KPIs, and tracking mechanisms.
But visibility alone doesn’t deliver change.
This is the gap Process Performance Management (PPM) closes – and it’s the gap many organizations struggle to overcome. In our blog, Process Performance Management: How to Measure, Monitor, and Improve What Really Matters, we explored the foundation: defining meaningful KPIs, aligning performance with strategy, and establishing ownership.
This blog continues that story. Here, we focus on what comes after monitoring – how to interpret insights, how to act on them, and how ADONIS by BOC Group helps organizations move from observation to improvement.
New to monitoring?
Start with our article How Process Monitoring Improves Operational Efficiency for an introduction to visibility, analytics, and detection.
Why Monitoring Isn’t Enough
Dashboards can highlight deviations, slow cycle times, or unstable KPI states. But they rarely answer the harder questions:
-
Why is this performance happening?
-
What is the impact on goals and strategy?
-
Which issues matter most?
-
Who is responsible for taking action?
-
How do we ensure improvements actually stick?
Monitoring gives you signals. Performance management gives you meaning.
PPM turns raw data into a coherent story, one that connects the performance of individual processes to organizational priorities, regulatory requirements, and customer outcomes.
Most companies don’t struggle with detecting issues. They struggle with making sense of them – and choosing the right intervention.
The Maturity Shift: From Tracking to Improving
Organizations that succeed with Process Performance Management all undergo the same maturity shift. They move from simply observing performance to actively shaping it.
1. They elevate KPIs from isolated metrics to strategic signals
A KPI means nothing unless it’s tied to a business objective, performance target, or risk area. In ADONIS, Performance Indicators link directly to Goals and Initiatives, creating a cause-and-effect chain that prevents meaningless measurement.
2. They make performance visible where work actually happens
Dashboards are not just for executives. Employees and process owners need insight in context – right inside their process diagrams, their tasks, their operational views. ADONIS accomplishes this through Insights dashboards embedded in every Business Process Diagram.
3. They assign ownership and accountability
Performance doesn’t improve just because a number moves. It improves because someone evaluates the number, understands its implications, and initiates the right action. Process Analysts, Initiative Owners, and Control Managers each get targeted views that align responsibility with insight.
4. They treat improvement as a continuous cycle
PPM is not a one-time project. It’s a continuous loop of insight, action, and validation. Teams use performance data to refine processes, apply changes, and confirm whether improvements actually deliver value – repeatedly and consistently.
Performance Management Is a Team Sport
Unlike monitoring, which is often centralized, performance management is distributed. Improvement requires collaboration across strategic, tactical, and operational layers.
Process Managers/Owners & Business Analysts
They connect the dots: process behavior, KPI trends, root causes, and redesign opportunities. They identify which gaps matter most and propose initiatives.
Initiative Owners, Change Managers & Control Managers
They turn insight into execution. They assess impact, prioritize interventions, and coordinate improvement plans linked to risks, compliance requirements, or strategic goals.
Employees & Process Participants
They provide the operational reality. Through embedded Insights dashboards in ADONIS, they see expectations, performance indicators, and the initiatives that affect their daily work.
Performance improves sustainably only when these layers are connected – and ADONIS is built precisely for this alignment.
How ADONIS Connects Performance to Strategy
A KPI by itself can show a deviation. A KPI linked to a goal shows its impact. A KPI linked to an initiative shows how the organization plans to respond. A KPI linked to a process shows where to take action. A KPI linked to a risk shows why it matters. A KPI linked to controls or topics shows how it is organized, governed, or categorized.
This is the essence of Process Performance Management: Performance is not a number – it’s a relationship model.
In ADONIS, the following objects work together to give performance real meaning:
-
Goals ←→ strategic intent
-
Performance Indicators (KPIs) ←→ measurable outcomes
-
Initiatives ←→ actions that drive change
-
Processes ←→ where performance is produced
Together, these relationships ensure every deviation leads to a structured, informed conversation:
-
Is the goal still valid?
-
Is the KPI measuring what matters?
-
Do we need an initiative?
-
Which process needs to change?
-
Who owns this?
This approach transforms improvement from ad-hoc fixes into repeatable, scalable cycles.
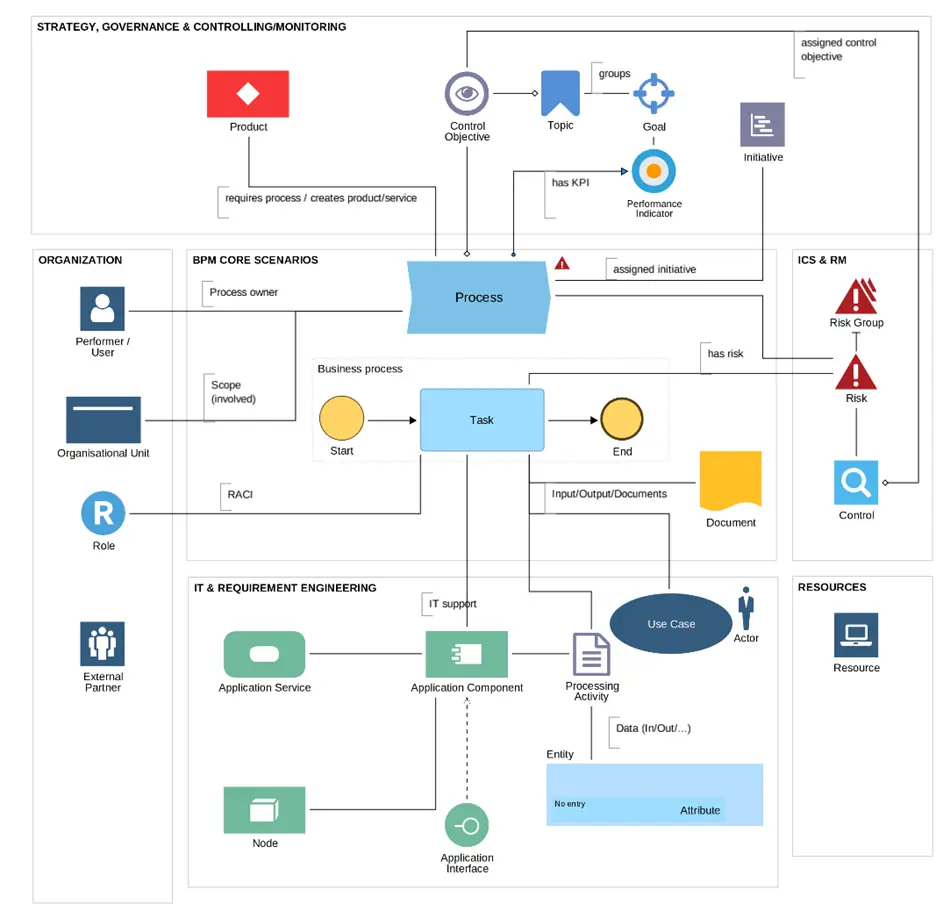
“Strategy, Governance & Controlling/Monitoring” section of the metamodel represents how strategic elements,
like objectives and initiatives, are connected to business processes and their other objects
Beyond Dashboards: Understanding the Story Behind the Numbers
Seeing a KPI is one thing. Understanding it is another. ADONIS provides multiple layers of insight that help teams interpret, diagnose, and prioritize what they see.
Dashboards That Surface What Matters Most
User-specific dashboards like My Processes & Assets give every user a personalized view of the KPIs, states, thresholds, and responsibilities that matter to them.
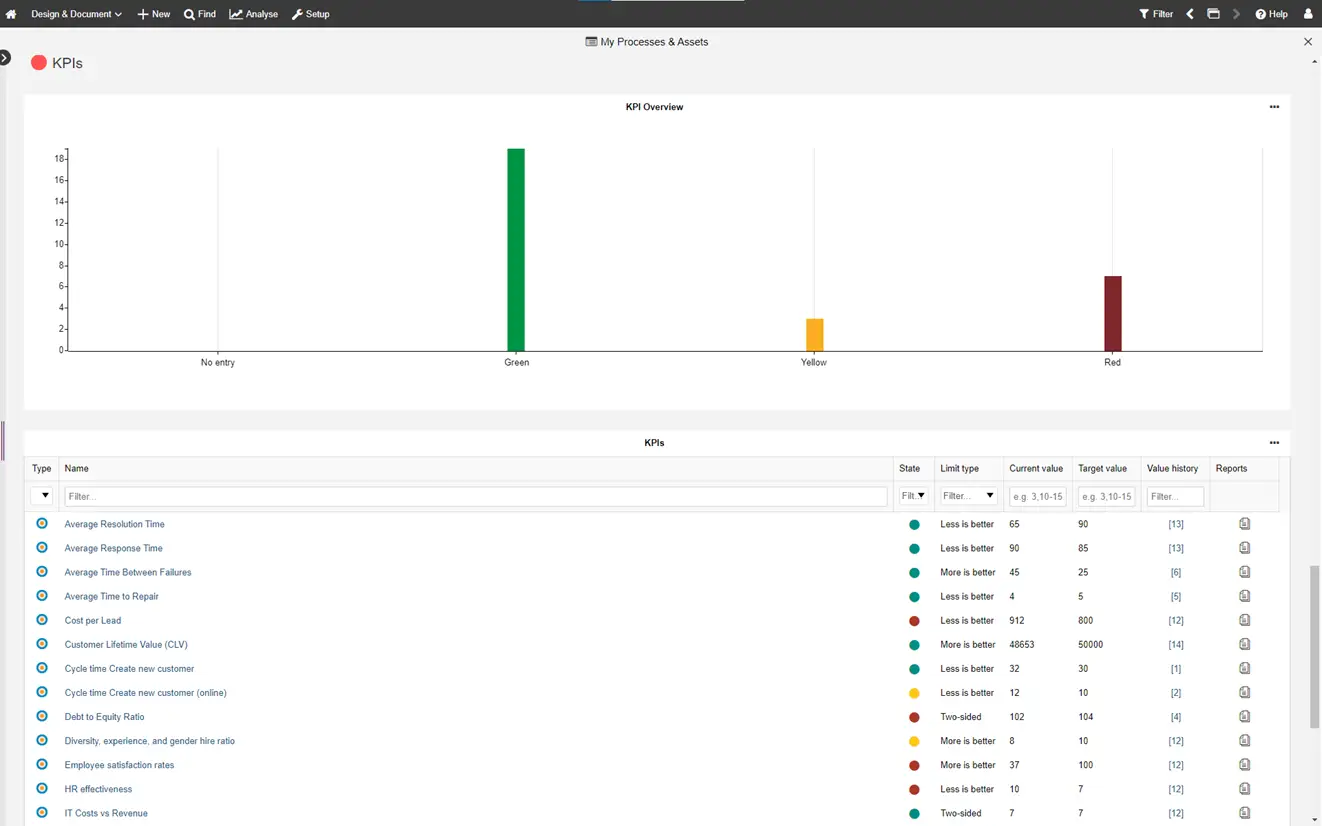
‘My Processes & Assets’ dashboard displays KPI states and their key attributes,
such as limit types, and current vs. target values
Visual Analytics That Reveal Hidden Patterns
Charts turn raw KPI values into interpretable signals. For example:
-
Box-in-Box charts group indicators by labels and topics to uncover systemic weaknesses.
-
Bubble charts visualize long-term trends and thresholds.
-
Conditional coloring highlights which indicators are stable, borderline, or critical.
These illustrate just a few ways visual analytics support performance analysis. They aren’t simply visual add-ons – they’re decision aids that help teams move from observation to diagnosis.
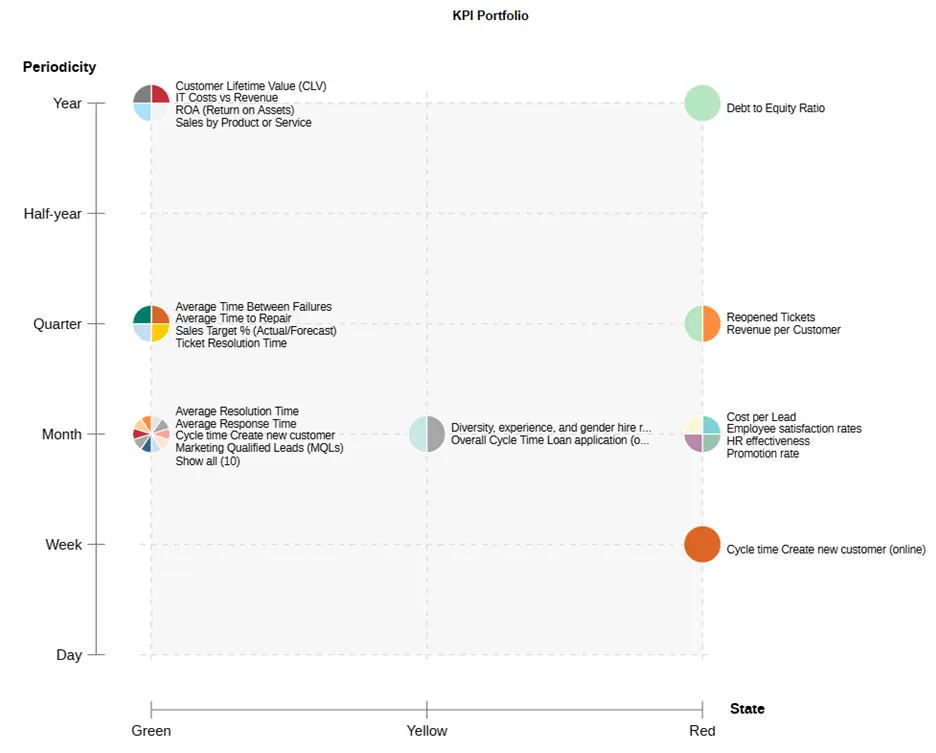
Performance Indicators can be visualized by periodicity and state,
helping highlight strong areas versus those needing attention.
Time and Category-Based Views
Snapshot views rarely reveal the full story.
By visualizing KPIs across:
-
time periods
-
categories
-
topics
-
process groups
-
strategic areas
ADONIS exposes underlying behavioral patterns that would otherwise remain invisible – recurring spikes, seasonal delays, structural bottlenecks, or chronic underperformance.
From Insight to Action: How ADONIS Enables Real Improvement
Once the root cause is understood, organizations need tools to act – not just observe. ADONIS provides complementary capabilities that complete the performance loop.
Process Mining – Ground Truth for Improvement
Mining reveals how processes truly run versus how they were designed. It uncovers:
-
hidden rework
-
deviations
-
slow paths
-
systemic delays
-
compliance violations
It validates whether performance issues stem from behavior, workload, system constraints, or process design flaws.
Process Automation – Turning Improvement Decisions Into Execution
Where mining identifies bottlenecks, automation helps solve them.
Automation reduces:
-
manual steps
-
cycle time
-
variability
-
compliance risk
It ensures that once performance gaps are identified, changes can be applied consistently at scale.
Strategy & Performance Management – Aligning Actions With Value
This module ties initiatives, KPIs, and strategic priorities together, ensuring:
-
improvements support measurable goals
-
changes are not isolated fixes
-
leadership has visibility into progress
It makes performance management a strategic discipline, not just an operational one.
The Closed Loop: Integrating Performance Across the PMLC
Process Performance Management fits into the Process Management Lifecycle at multiple stages, but its core focus is on monitoring, evaluating, and improving processes. This means it is tightly integrated with both strategic and operational levels.
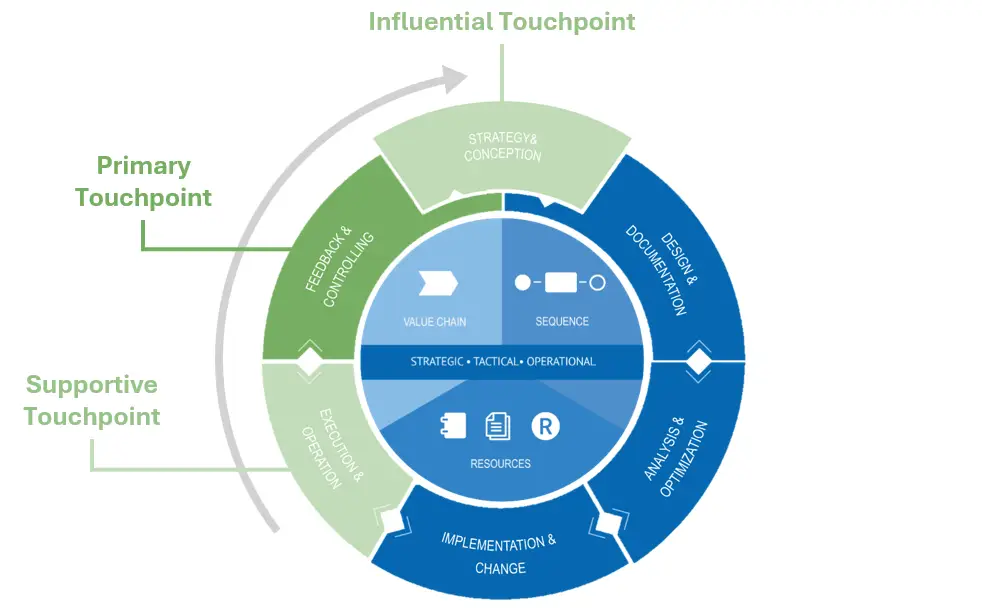
Process Performance Management fits into the Process Management Lifecycle (PMLC) at multiple stages,
but its core focus is on monitoring, evaluating, and improving processes.
Execution & Operation (Supportive Touchpoint)
This stage generates the operational data that feeds Process Performance Management. Related activities that usually happen on this stage are:
- Dashboards for ongoing process monitoring
- Warnings or alerts for deviations and violations
- Receives insight from PPM to guide strategic goals, KPIs, and initiatives
Feedback & Controlling (Primary Touchpoint)
This is where you measure process performance, using KPIs and monitoring tools, so we can consider this stage as the primary touchpoint for Process Performance Management. Related activities that usually happen on this stage are:
- Collecting performance data (e.g., cycle time, cost, error rates)
- Comparing actual vs. target performance
- Identifying improvement opportunities
- Feeding back into strategy or redesign
Strategy & Conception (Influential Touchpoint)
Process Performance Management provides strategic insight through performance indicators, and informs goal-setting, KPI definition, and resource allocation. Related activities that usually happen on this stage are:
- Using past performance data to define realistic goals
- Aligning business strategy with measurable process outcomes
Other stages can also connect to Process Performance Management in an indirect way. Design and Documentation introduce the goals, objectives and measurable KPIs that guide later assessment. Analysis and Optimization then highlight where performance falls short and where improvements are possible. Implementation and Change activities build on these insights, since the effects of any adjustment become visible through ongoing performance measurement.
Summary
KPIs alone don’t improve processes. What improves processes is a connected performance model – one that links strategy, measurement, analysis, and action.
With ADONIS, organizations move from simply tracking numbers to truly mastering process performance. They see not only how well processes run but also why issues occur, what actions to take, and how improvements connect to strategic goals.
This is what turns monitoring into mastery – and transforms KPIs from passive reports into powerful drivers of organizational change.


Already got our weekly updates?