Found this helpful? Share it with peers.
Introduction
Reaching process excellence depends on two core elements: structure and insight. Business Process Management (BPM) defines how work gets done. But knowing the structure is only part of the picture. Teams also need insight into how those processes actually perform. That’s where Business Intelligence (BI) helps. It gives teams the ability to assess results, find problem areas, and choose where to improve.
One way to understand how BI supports BPM is through the Process Management Lifecycle (PMLC). This framework outlines the key phases involved in process management. Because the cycle is continuous, feedback plays a central role. BI is especially useful in the Feedback and Controlling phase, where performance data helps teams assess results and focus their next steps.
Hint: Check out our blog post on Process Monitoring for a deeper dive into the Feedback and Controlling phase of PMLC.
This blog explores how BI and BPM work together to support informed decisions and process improvement. Explore practical examples of how analytics helps organizations adjust and refine processes based on real performance over time.
How Business Intelligence Supports BPM and Data-Driven Decisions
With digital transformation moving forward, data-driven decision-making (DDDM) has become a key part of how businesses plan and act. Instead of relying on gut feeling or outdated reports, teams turn to real-time data to support day-to-day decisions.
Why Data-Driven Decision-Making is Essential
Markets shift fast. Competitive pressure is constant. Relying on outdated reports or past habits can slow teams down or cause them to miss what matters. With BI built into BPM, teams have access to timely information that helps them respond based on what’s actually happening.
When combined with BPM platforms like ADONIS, BI tools give a clearer view of how processes perform. This helps teams with:
- Faster adaptation to internal or market shifts
- Clearer visibility into delays or process bottlenecks
- Earlier detection of risks, with time to respond effectively
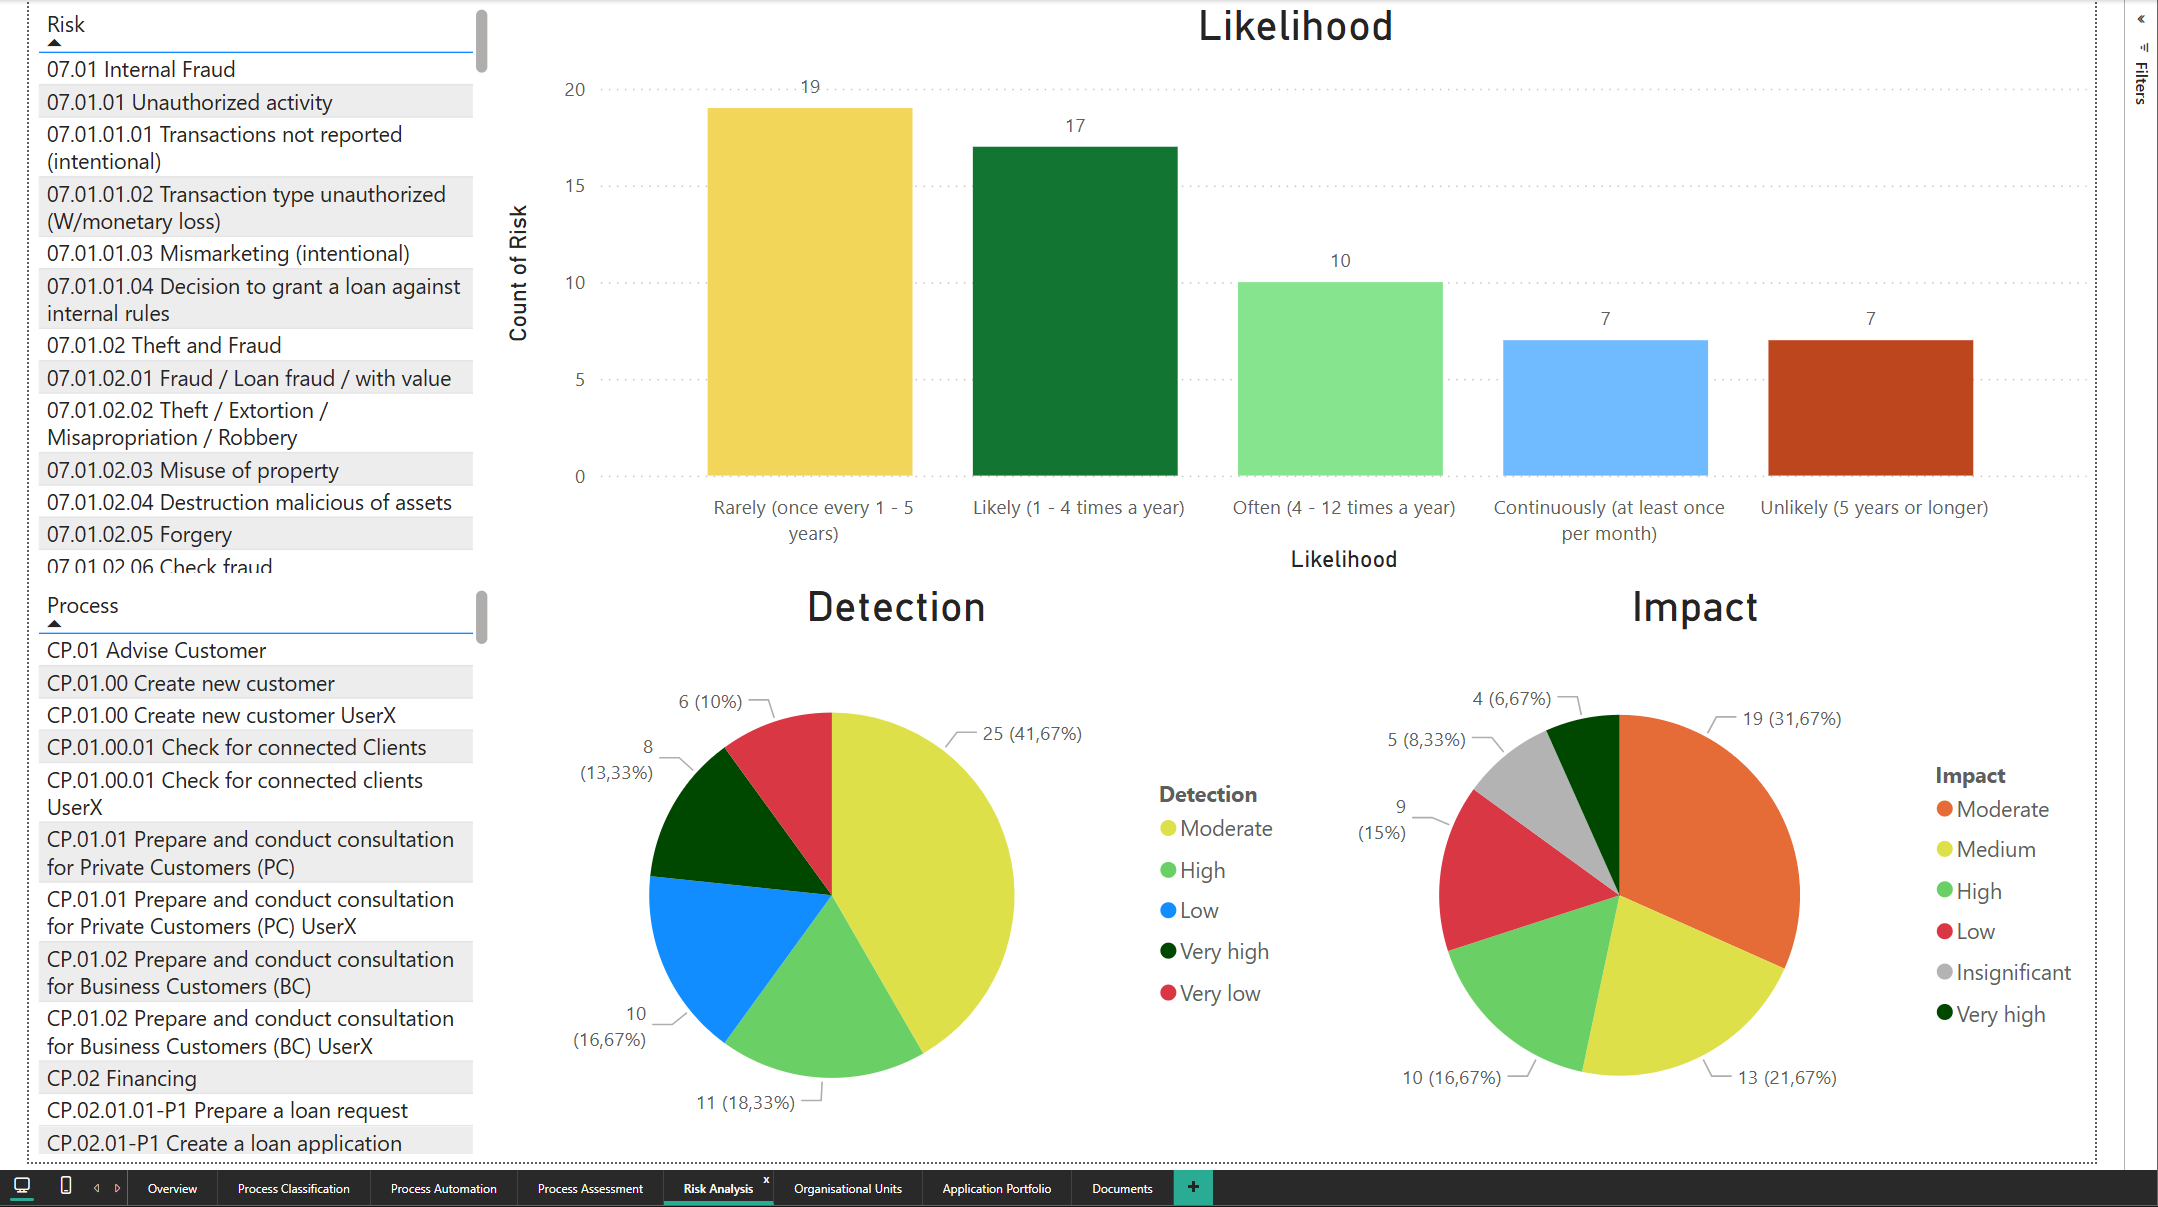
Example of BI-enhanced Risk Analysis
The Rise of Big Data in BPM
With growing volumes of operational data, analytics is no longer optional in BPM. Tools that support Process Intelligence help make sense of complex process landscapes. They help identify weak points, analyze trends, and inform better decisions at every stage.
The Link Between BPM and BI – How process management benefits from business intelligence
Understanding the Role of BPM in Process Optimization
BPM helps organizations bring structure to how their work gets done. It’s used to design, track, and improve processes so that day-to-day stays efficient and operations support broader business goals. With BPM in place, teams can manage processes more clearly and reduce the risk of disjointed execution.
However, BPM alone lacks the depth of data-driven analysis to optimize performance dynamically. To address that, Business Intelligence becomes an important addition.
What Business Intelligence Adds to BPM
BI gives teams access to process-related data they wouldn’t otherwise see. Instead of waiting for periodic reviews, they can check the numbers as they work and adjust in smaller, more targeted steps.
For example:
-
BI-driven Insights: A dashboard can show where a process slows down or where targets aren’t being met. That makes it easier to step in and make small changes that improve the flow.
-
Process Automation: Process data can also support automation. When routine steps are tracked and measured consistently, teams can start handing those over to systems instead of doing them manually.
- Predictive Analytics: Trend reports allow teams to prepare for changes before they happen. When data points in a clear direction, it’s easier to adapt instead of reacting late.
Key Benefits: How Business Intelligence Supports BPM
The combination of Business Process Management and Business Intelligence offers numerous transformative benefits for businesses, for instance:
1. Enhanced Efficiency through BI-Driven Process Insights
Using BI with BPM helps teams understand where work is slowing down or getting blocked. Dashboards reveal how processes actually run, so it’s easier to see where to step in. That visibility makes it possible to adjust workflows, reduce delays, and shift manual tasks toward automation where it makes sense.
2. Improved Transparency and Accountability through Business Intelligence
Better Performance Tracking: Businesses can continuously track efficiency metrics and make informed decisions.
Improved Accountability: Real-time visibility ensures that all stakeholders are aligned with process objectives.
A Stronger Data-Driven Culture: Employees and management make decisions based on facts rather than assumptions.
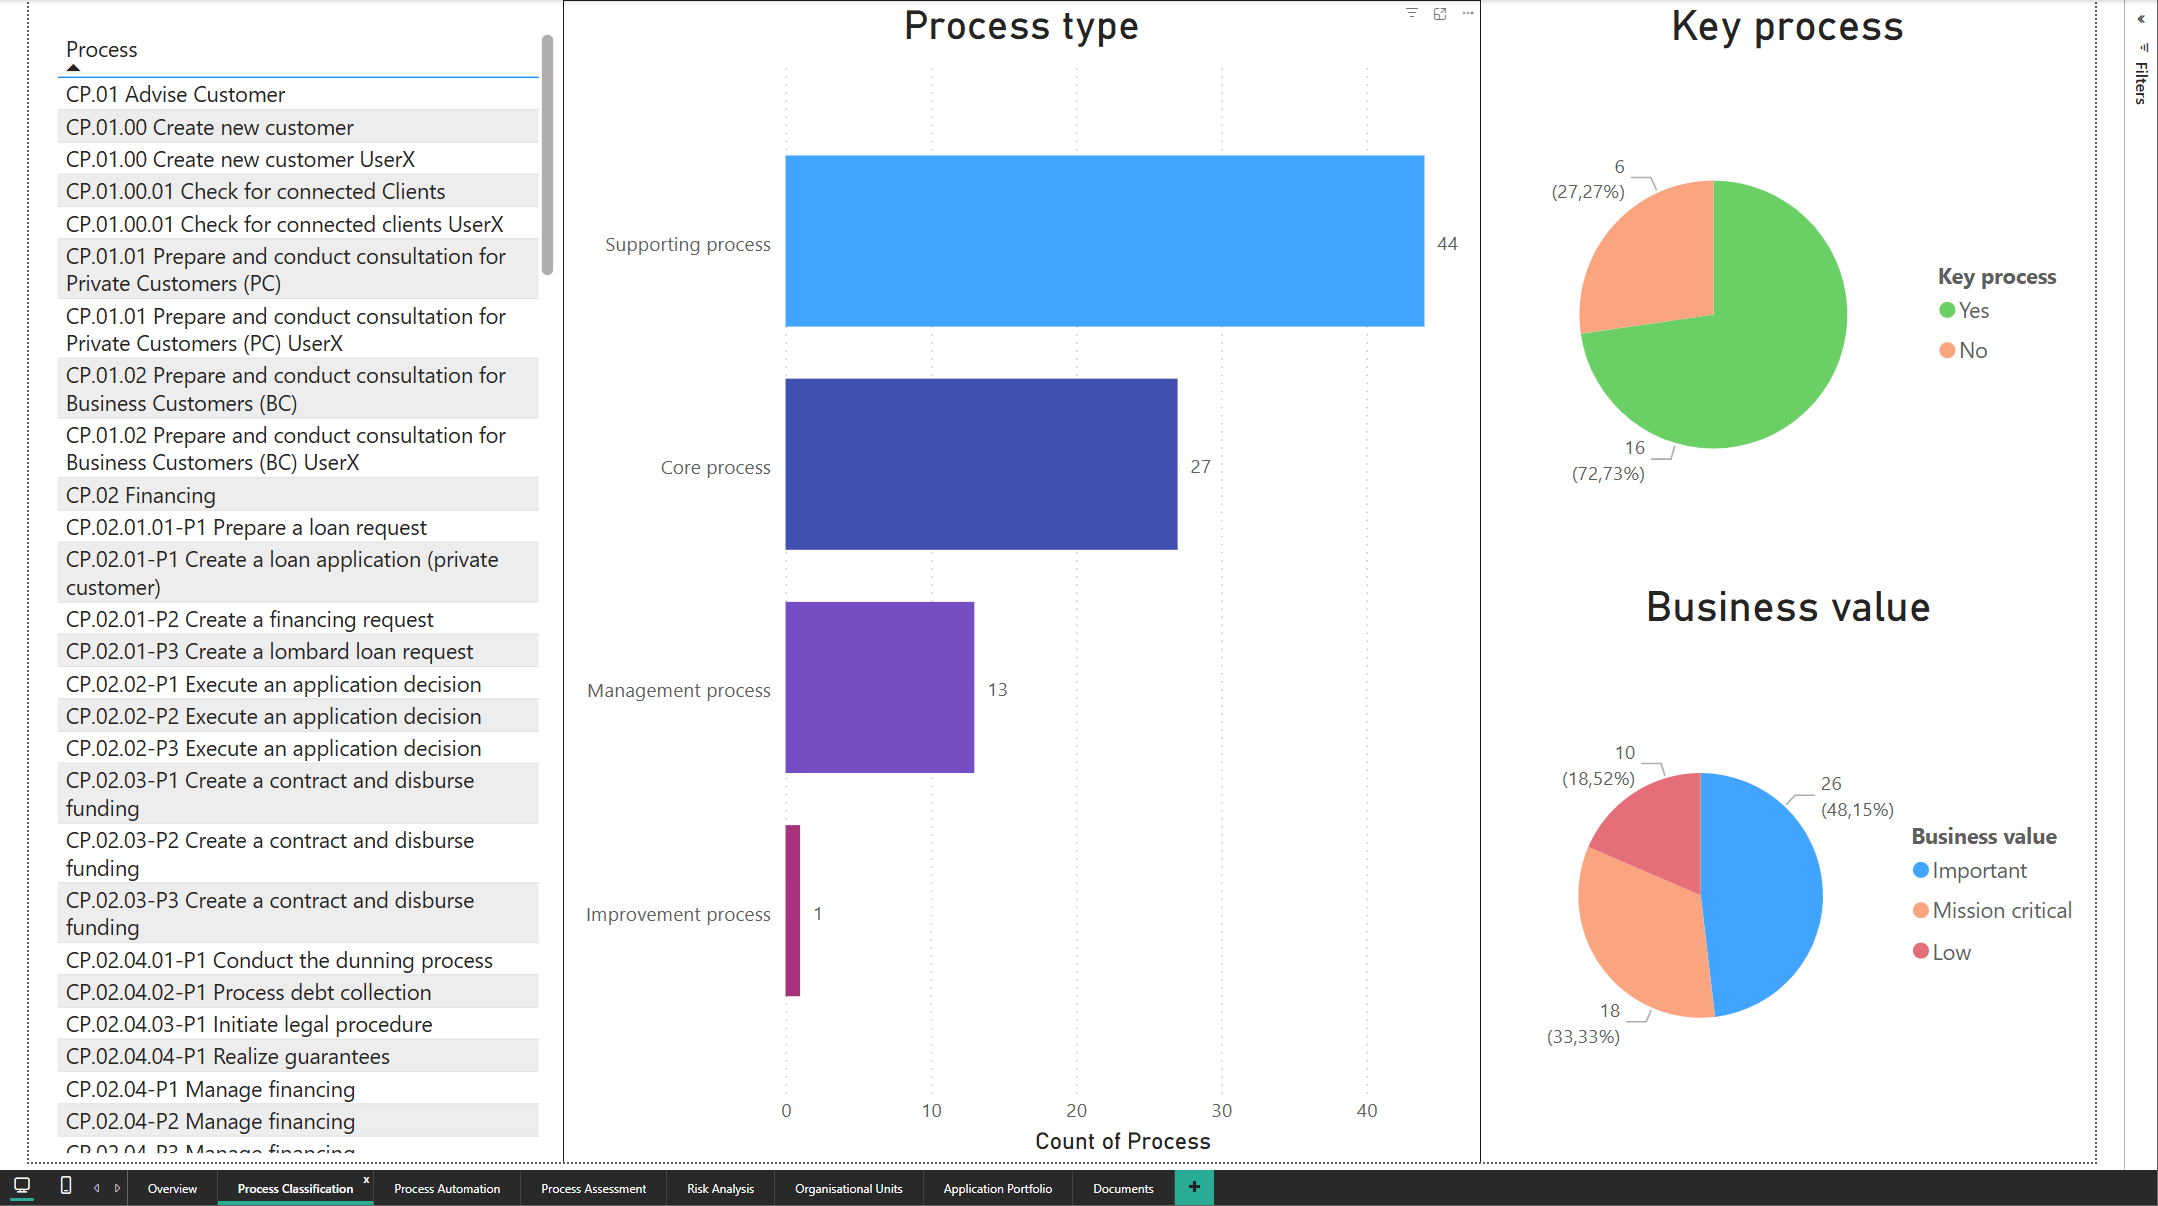
Example of BI-enhanced Process Classification
3. Continuous Improvement: How Business Intelligence Supports BPM Evolution
A major strength of BI-enhanced BPM is the ability to improve processes steadily over time. This happens by combining quantitative data insights with qualitative employee feedback. When both are used together, decisions are based on facts and grounded in day-to-day reality.
Quantitative Insights Meet Human Experience: BI highlights trends and provides performance data that help teams see where things stand. But numbers alone don’t explain everything. Feedback from employees adds context, helping teams make choices that work in practice.
Proactive Rather Than Reactive: Real-time data gives teams a chance to catch problems early. When they combine that data with input from people close to the process, improvements become more effective and timely. It’s easier to act before issues escalate, and the response tends to reflect what actually works.
Scalability: As organizations grow, their processes become more complex. BI helps keep track of what’s changing. At the same time, employee feedback keeps improvements grounded and ensures that what worked at one stage still makes sense as things evolve.
Long-Term Cost Savings: BI reveals where resources are wasted or where steps could be simplified. Feedback helps explain why those issues happen and what might be a better approach. This combination leads to smarter use of automation and better control over ongoing costs.
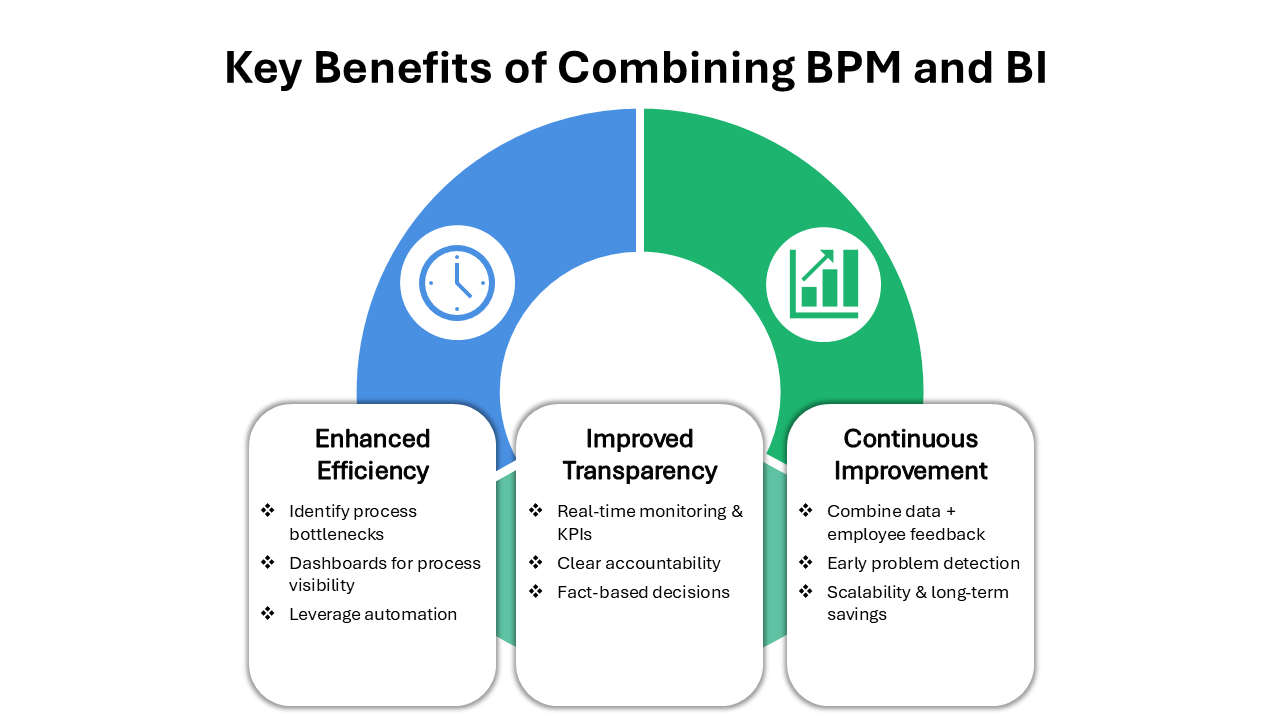
Key Benefits: How Business Intelligence Supports BPM
BPM and BI in Action – Industry Use Cases
Here are some industry-inspired examples of how Business Intelligence can enhance BPM, reflecting common practices and real-world experience across various sectors:
Financial Services: Streamlining Loan Approval Processes
Challenge: Reducing Loan Processing Time
Background: A mid-sized bank struggles with slow loan approvals, which creates delays for customers and puts future business at risk. To address the issue, the bank connects its BPM framework with a Business Intelligence solution (e.g. Power BI), using process data from ADONIS through REST APIs to support analysis in the BI tool.
Solution:
End-to-End Process Mapping:
The bank uses ADONIS to model the complete loan approval process, from application submission to final decision, capturing detailed process steps, responsibilities, and SLAs. This mapping helps in identifying structural bottlenecks such as redundant approval steps and unclear handoffs.
Data Integration & Bottleneck Analysis in BI:
Using the REST APIs, the bank can extract structured metadata from ADONIS, including process models, RACI data, and KPIs, and combine it with historical event logs (e.g., time stamps from core banking systems). In Power BI, inefficiencies such as delays caused by IT support issues or deviations from expected SLA times were visualized through interactive dashboards, enabling clearer insights into process performance. This enables a differentiated view, showing not just where delays occur, but whether it happens due to resource constraints, system errors, or policy bottlenecks.
Automation Insights & Decision Support:
With the insights from Power BI, the bank can identify candidate processes for automation. For example, repetitive manual credit checks that could be automated based on predefined rules. While this step doesn’t involve ADONIS Process Automation directly, BI highlights clear priorities for where automation would yield the most value – e.g., reducing human input in data verification or risk scoring.
Performance Dashboards for Transparency:
Custom BI dashboards can be combined with KPIs from ADONIS for real-time operational data. Executives could monitor loan throughput times, approval rates by branch, and customer satisfaction scores. For instance, a dashboard can show deviations between modeled SLA durations (from ADONIS) and actual durations (from event logs), helping management enforce accountability.
Scenario Simulations and What-If Analysis:
By combining modeled expectations from ADONIS with Power BI’s what-if parameter functionality, the bank can simulate different loan approval strategies – for example, removing one layer of approval or adjusting credit score thresholds. While distinct from simulation in ADONIS (which focuses on execution forecasting), Power BI enables dynamic scenario planning by tweaking variables and observing forecasted impacts on KPIs like processing time and risk exposure. This feedback loop between design and reality allows for continuous optimization.
Results:
Faster Loan Processing:
Average approval time is significantly reduced, leading to quicker decision-making and reduced customer churn.
Targeted Process Optimization:
Redundant approval steps and unclear handoffs are eliminated based on visual bottleneck analysis.
Automation Opportunities Identified:
BI dashboards help highlight high-impact automation candidates, such as repetitive credit checks and data verification tasks.
Improved Transparency and Control:
Executives gain real-time visibility into branch-level throughput, SLA compliance, and customer satisfaction via interactive dashboards.
Higher Customer Satisfaction:
Enhanced responsiveness and smoother loan processing contribute to improved NPS and lower application abandonment rates.
Healthcare: Optimizing Patient Flow in Hospitals
Challenge: Improving Hospital Throughput
Background: A large urban hospital faces overcrowding and inefficient patient flow, impacting both patient experience and resource allocation. To resolve this, the hospital integrates BI tools (e.g., Power BI) with its BPM system, leveraging process insights from ADONIS via REST APIs to enhance process visibility and predictive capacity.
Solution:
End-to-End Process Mapping:
The hospital begins by modeling all critical patient care pathways in ADONIS, from admission and triage to treatment, discharge, and follow-up. This detailed process mapping reveals where issues occur, such as delays or repeated handoffs. It also creates a starting point for tracking performance and planning improvements.
Process Simulation with ADONIS:
Using ADONIS’s built-in simulation features, the hospital tests different variations of care processes. For example, the hospital runs simulations to test whether adding triage staff during peak hours or changing diagnostic workflows would improve performance. The results show how these changes might affect timing and resource use, giving leadership a clearer basis for planning adjustments.
Process & Data Integration:
Data from patient admission, treatment stages, and discharge (sourced from the hospital’s ERP and clinical systems) is integrated into Power BI. By combining this operational data with process execution metadata from ADONIS, the hospital gains a unified, real-time view of how care processes are actually unfolding on the ground.
Performance Dashboards & Bottleneck Detection:
Power BI dashboards show patient waiting times, bed occupancy, and department-level workload. Process data from ADONIS, including task durations and execution paths, is added to these views. This helps managers see where bottlenecks are happening and what steps are most affected. With this detail, they can focus on the right areas and make targeted improvements.
Predictive Analytics for Resource Allocation:
Using Power BI’s forecasting tools, the hospital builds models that estimate patient inflow based on past admissions, seasonal shifts, and weekday patterns. These predictions help operations teams prepare for busy periods. With better planning, they can adjust staffing, bed availability, and equipment use to avoid delays and reduce pressure on care teams.
Scenario Simulations and What-If Analysis:
In addition to simulations in ADONIS, the hospital uses Power BI to test different operational situations. For example, they simulate a spike in emergency visits or a drop in staffing during flu season. By changing variables like patient numbers or available resources, planners can see how different conditions affect outcomes and use that insight to improve readiness.
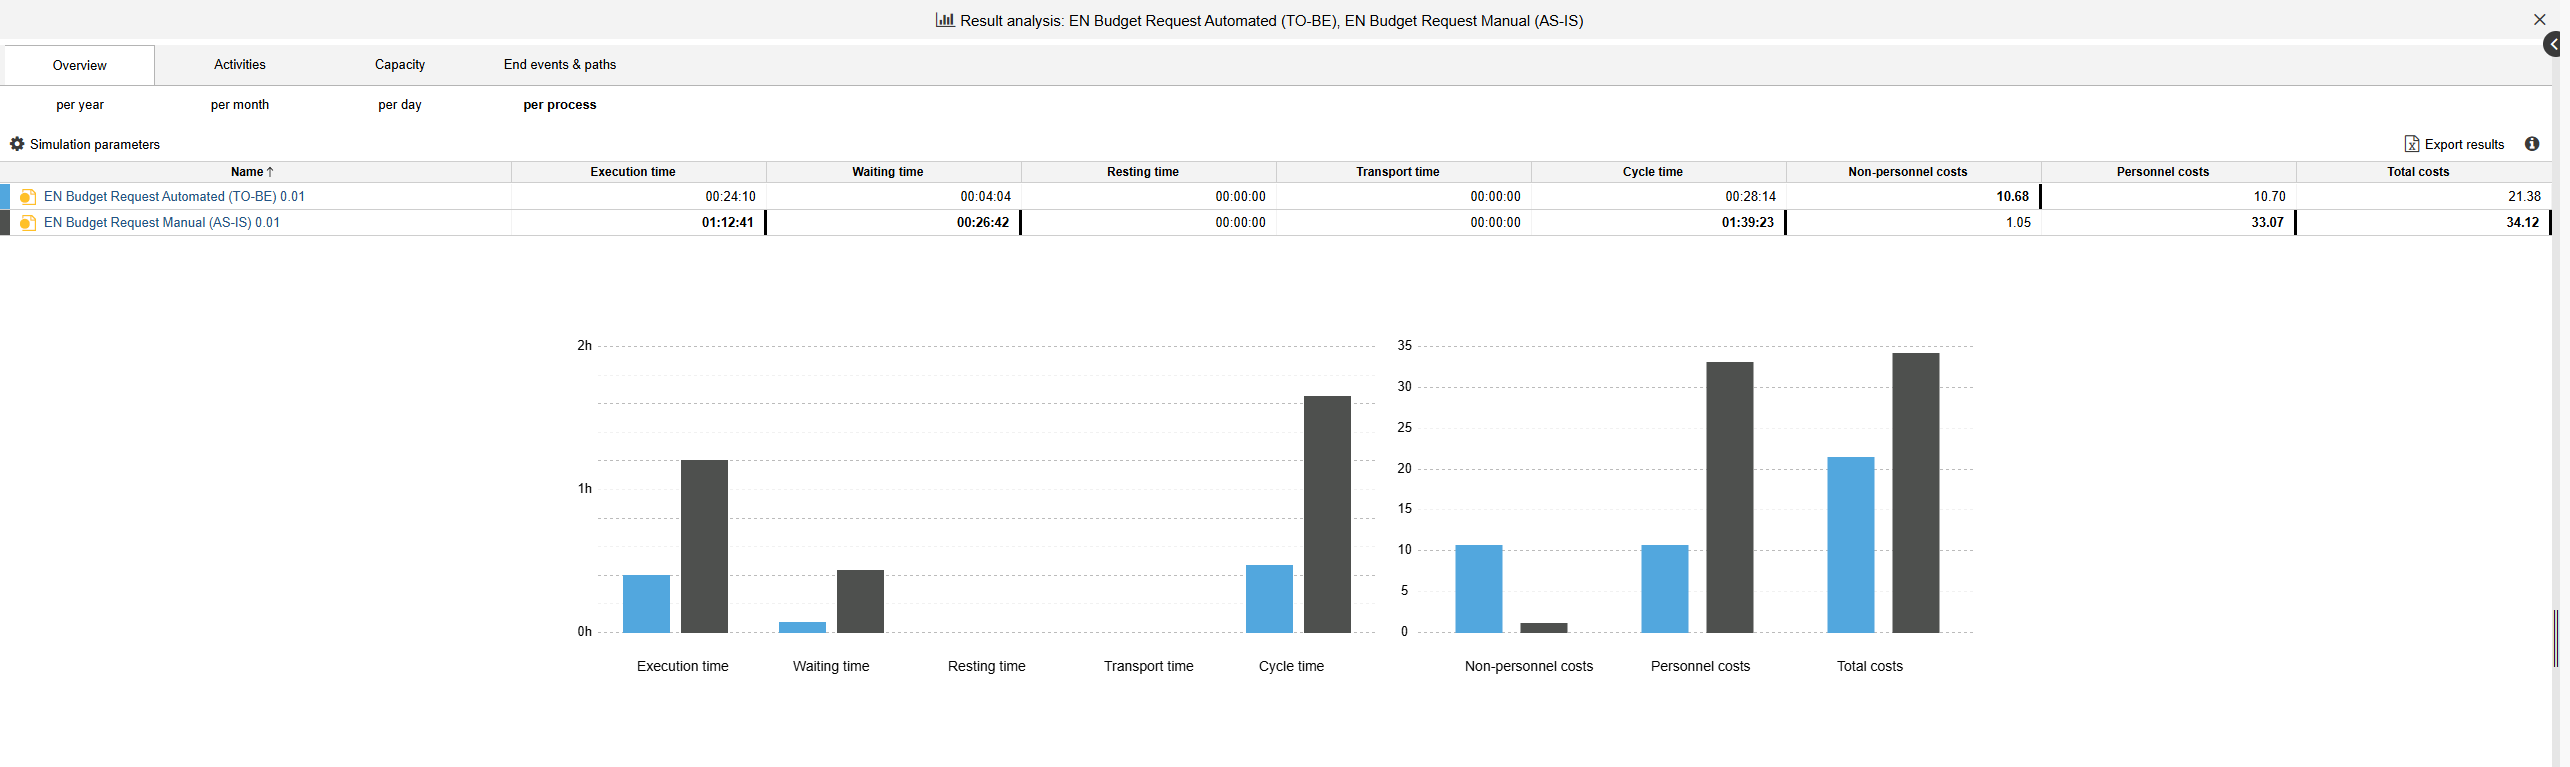
Example of Simulation Dashboard in ADONIS
Results:
Reduced Patient Waiting Times:
Average wait times in emergency and inpatient areas drop through targeted process improvements.
Bottleneck Detection:
BI dashboards help managers trace delays to the steps or teams where problems start.
Resource Planning:
Predictive models make it easier to prepare for busy periods and balance staff and bed use.
Adapting Workflows:
Simulations show what could happen if things change, like a shift in patient volume or available staff.
Patient Impact:
Care feels more consistent and timely, which improves patients’ experience at the hospital.
Key Steps to Implement Business Intelligence to Support BPM
Successfully integrating BI with BPM requires a structured approach to ensure that process insights translate into meaningful business value.
Here are the key steps:
1. Assess Your Current BPM System & Identify BI Opportunities
- Map out existing processes in ADONIS.
- Identify inefficiencies or process gaps where BI-driven insights could improve decision-making.
- Define key performance indicators (KPIs) and determine how BI can help track and optimize them.
2. Ensure Seamless BI & BPM System Integration
- Select a BI solution that aligns with your process management ecosystem.
- Consider BI tools like Power BI or Qlik that integrate with BPM platforms like ADONIS.
- Focus on centralizing process-related data within your BPM system to ensure process owners have access to comprehensive dashboards.
3. Train Your Team to understand BI insights
- Educate process owners, managers, and key stakeholders on how to interpret and act on BI insights.
- Encourage data-driven decision-making by embedding BI dashboards into day-to-day process management.
4. Monitor, Simulate, and Continuously Improve
- Use BI-enhanced BPM dashboards to track performance metrics and detect process inefficiencies.
- Run scenario simulations to test different process variations and forecast potential issues.
- Iterate and refine BPM strategies based on historical trends, predictive analytics, and employee feedback.
Summary
Process management depends on visibility. When teams understand how work flows in practice, they are better prepared to spot problems and take action. Business Intelligence adds that layer of insight by turning data into something teams can work with directly.
Used alongside BPM, it helps shift attention to what is actually happening rather than what is assumed. Over time, this leads to better decisions and more control over how processes evolve.


")


Already got our weekly updates?