Found this helpful? Share it with peers.
Why Metrics Matter in Application Portfolio Management
You can't improve what you don't measure, and in Application Portfolio Management (APM), that's especially true.
Many organizations invest time (and money) in assessing applications, defining strategies, and building roadmaps. However, this is all in vain without the right metrics in place. Skipping this part makes it nearly impossible to determine whether your portfolio is becoming leaner, more efficient, or more aligned with business goals.
This article focuses on the APM metrics that truly indicate portfolio health, helping you move from subjective assessments to data-driven decision-making.
What Does “Application Portfolio Health” Really Mean?
A "healthy" application portfolio isn't just cost-efficient. A portfolio in good shape also aligns with business strategy and stays technically sustainable. Its applications are actively used and deliver real value, and it carries no unnecessary risk or redundancy.
To measure all of this, you need a balanced set of KPIs. Cost and technical condition cover part of the picture, but your metrics also have to show how much business value each application delivers.
The Core APM Metrics That Matter Most
1. Total Cost of Ownership (TCO)
Understanding the true cost of an application goes far beyond license fees. In fact, TCO includes:
- Maintenance and support
- Infrastructure and hosting
- Operational overhead
- Upgrade and migration costs
Why it matters:
Without a clear view of TCO, cost optimization becomes guesswork.
What it reveals:
It surfaces the cost drivers that usually stay hidden, along with the budget inefficiencies tied to them, and it points to where consolidation makes sense.
Best practice:
Track cost attributes directly at the application level to create full transparency across your portfolio.
2. Business and IT Fitness Scores
Not all applications are equal. Some drive competitive advantage, others simply keep operations running.
A fitness score rates an application on two fronts. Business fitness captures how much value it delivers to the organization, while IT fitness reflects its technical quality and how maintainable it is.
Why it matters:
This metric helps you tell strategic assets apart from liabilities.
What it reveals:
It shows which applications deserve more investment and which ones to either tolerate as they are or move off and retire. It also surfaces the gaps where IT and business needs have fallen out of alignment.
Best practice:
Use standardized evaluation criteria and scoring models to keep results consistent across the portfolio.
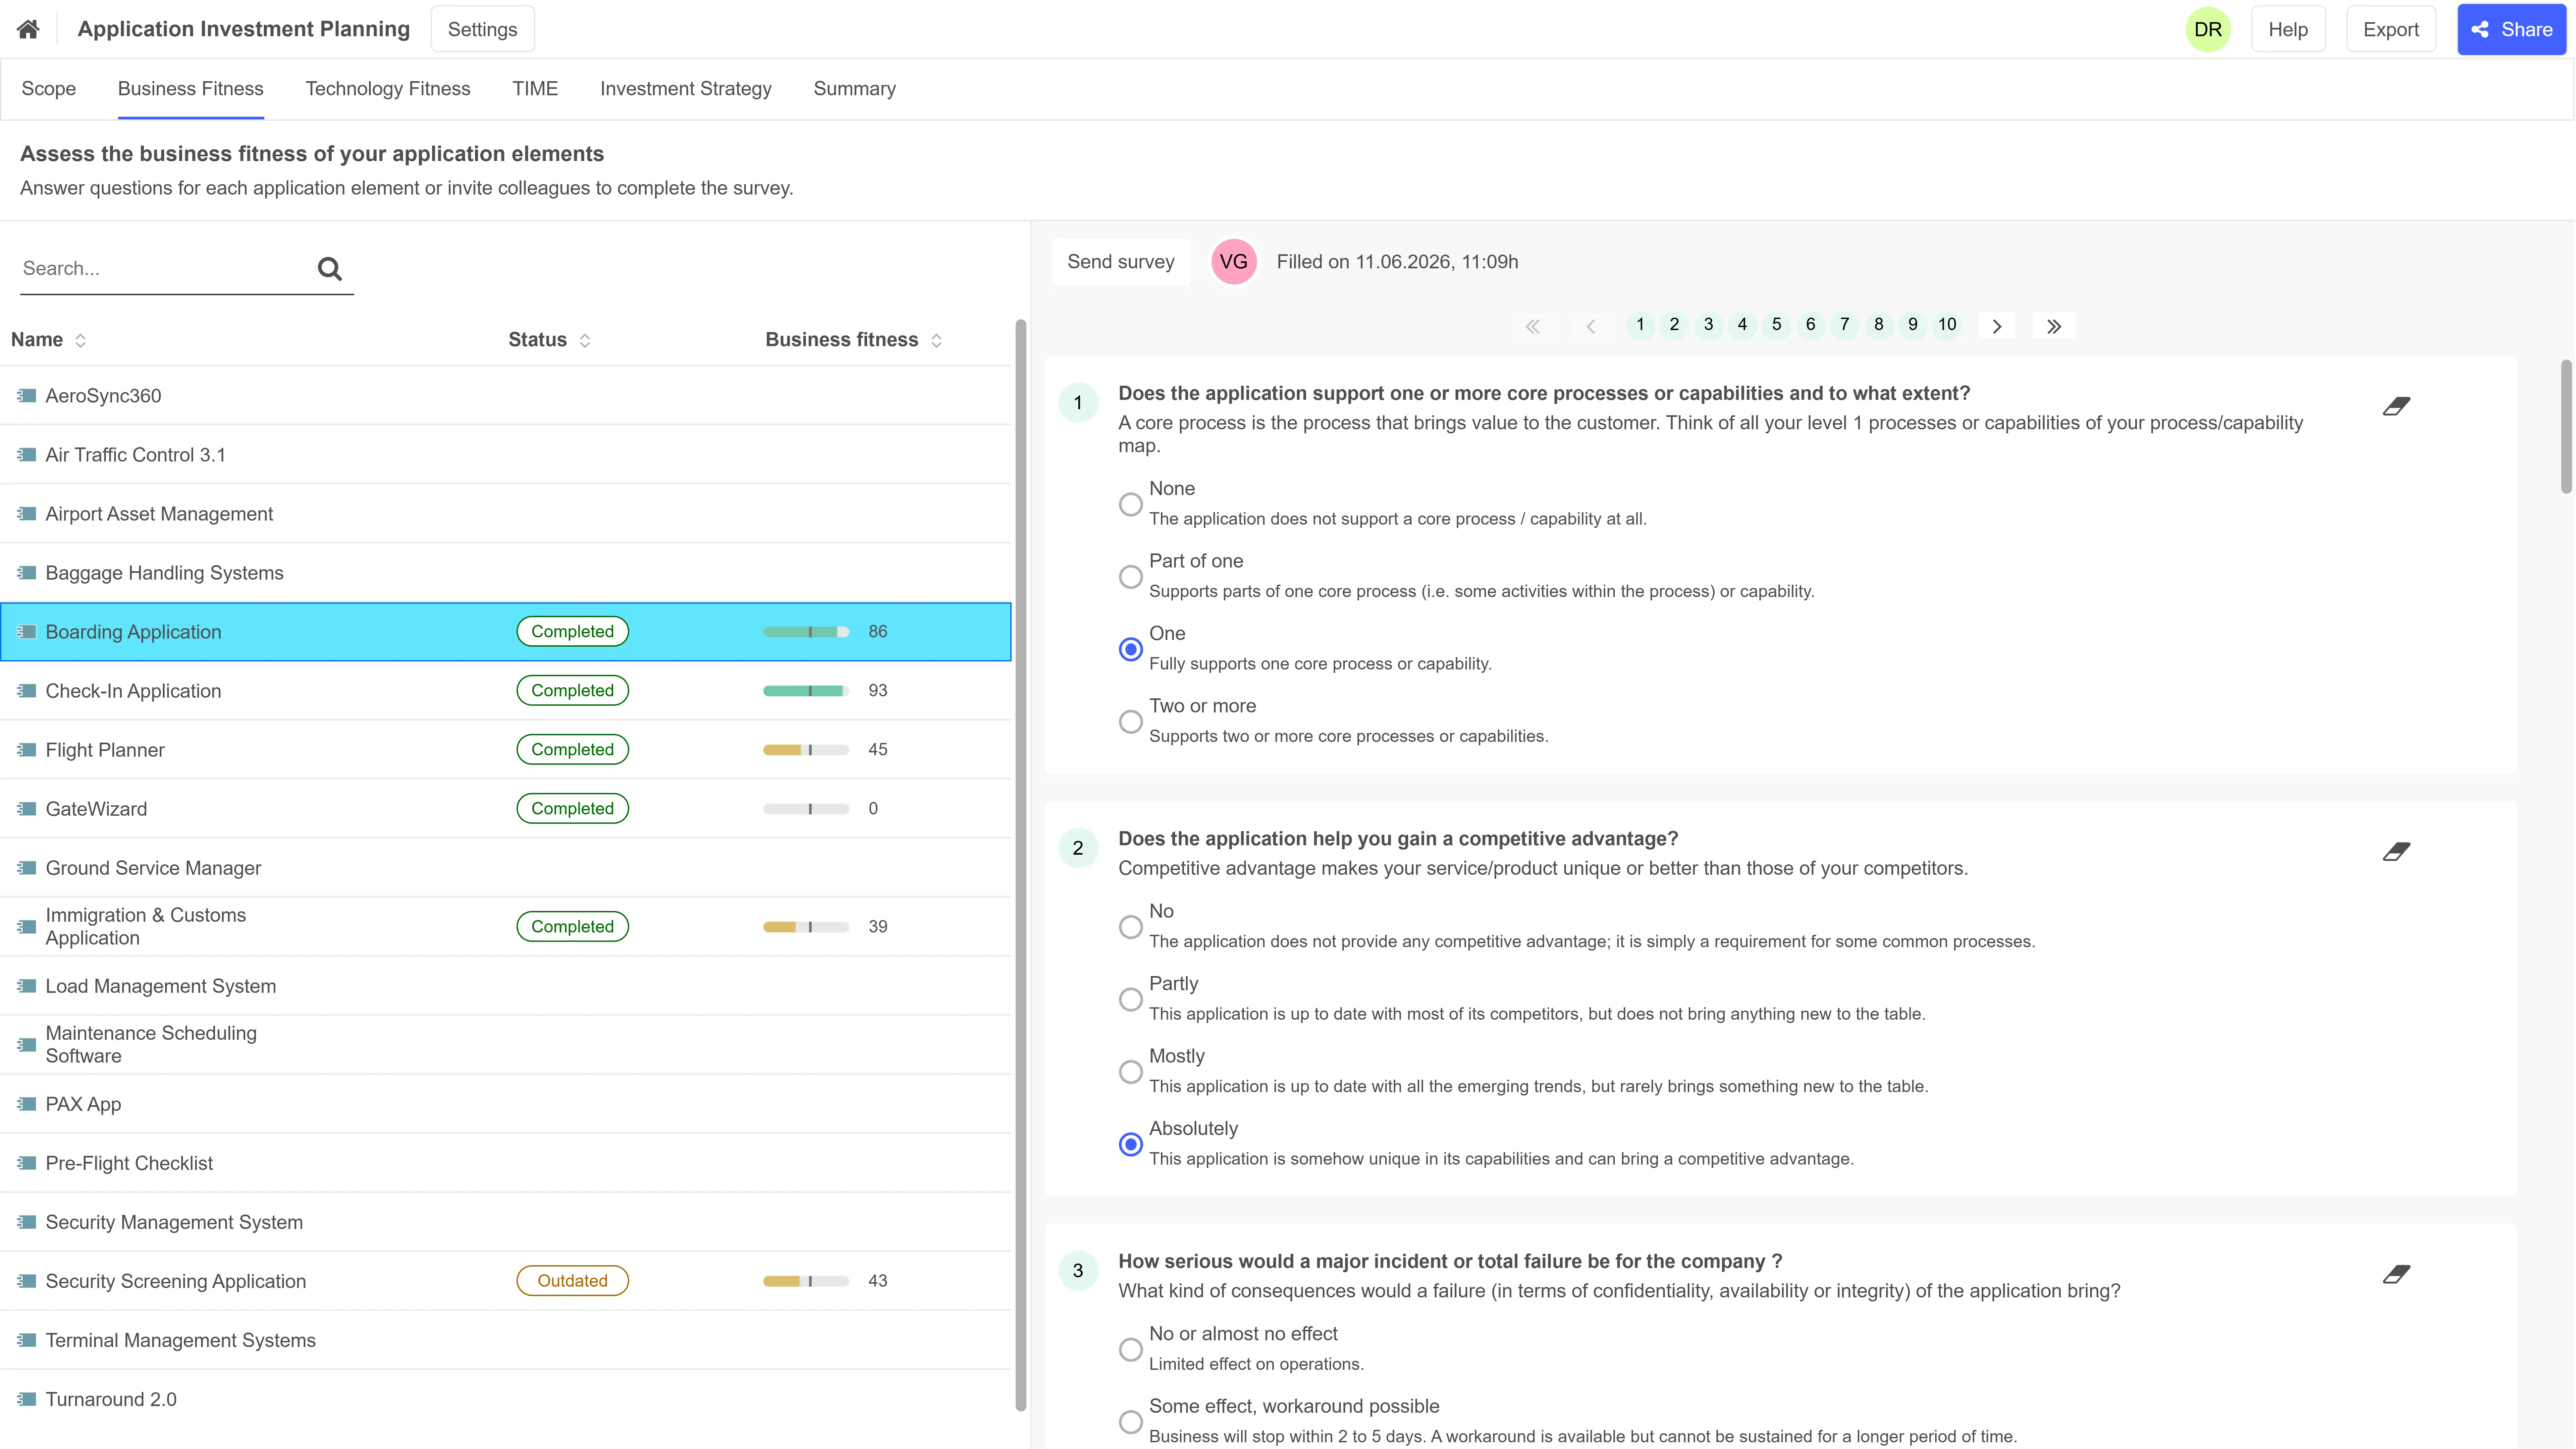
Application business fitness assessment in ADOIT
3. Application Health Index
Application health measures the risk level of your systems based on factors like:
- Stability and performance
- Security posture
- Technical debt
- Maintainability
Why it matters:
Applications with low health index increase the likelihood of outages, security incidents, and rising costs.
What it reveals:
It pinpoints the high-risk systems that need attention now and exposes the weak points across your IT landscape. It also makes long-term technical debt trends visible as they build.
Best practice:
Use visual signals (e.g. traffic-light systems) to quickly identify critical applications.
4. Application Usage and Adoption
An application that isn’t used is a cost without value.
Usage metrics track how many people actively use an application and how often they turn to it. They also show how adoption shifts over time.
Why it matters:
Low usage usually means something is off. The application might be redundant or hard to use, or it may have simply lost its relevance to the business.
What it reveals:
It exposes shadow IT and duplicate tools, and it points to where consolidation could pay off. It can also reveal where users need better training or onboarding.
Best practice:
Combine usage data with business context so you don’t misread niche but business-critical applications.
5. Lifecycle Stage
Every application has a lifecycle, from introduction to retirement. Tracking lifecycle stages helps you understand:
- Which applications are nearing end-of-life
- Where modernization is required
- How future risks are distributed
Why it matters:
A portfolio overloaded with aging systems is a ticking time bomb.
What it reveals:
It clarifies which applications to upgrade or replace first and where you face the risk of vendor end-of-support. Those signals together tell you how sustainable your IT landscape will be over the long term.
Best practice:
Visualize lifecycle stages across the portfolio to plan transitions proactively.
Hint: Stay ahead of end-of-life risks with structured Technology Lifecycle Management.
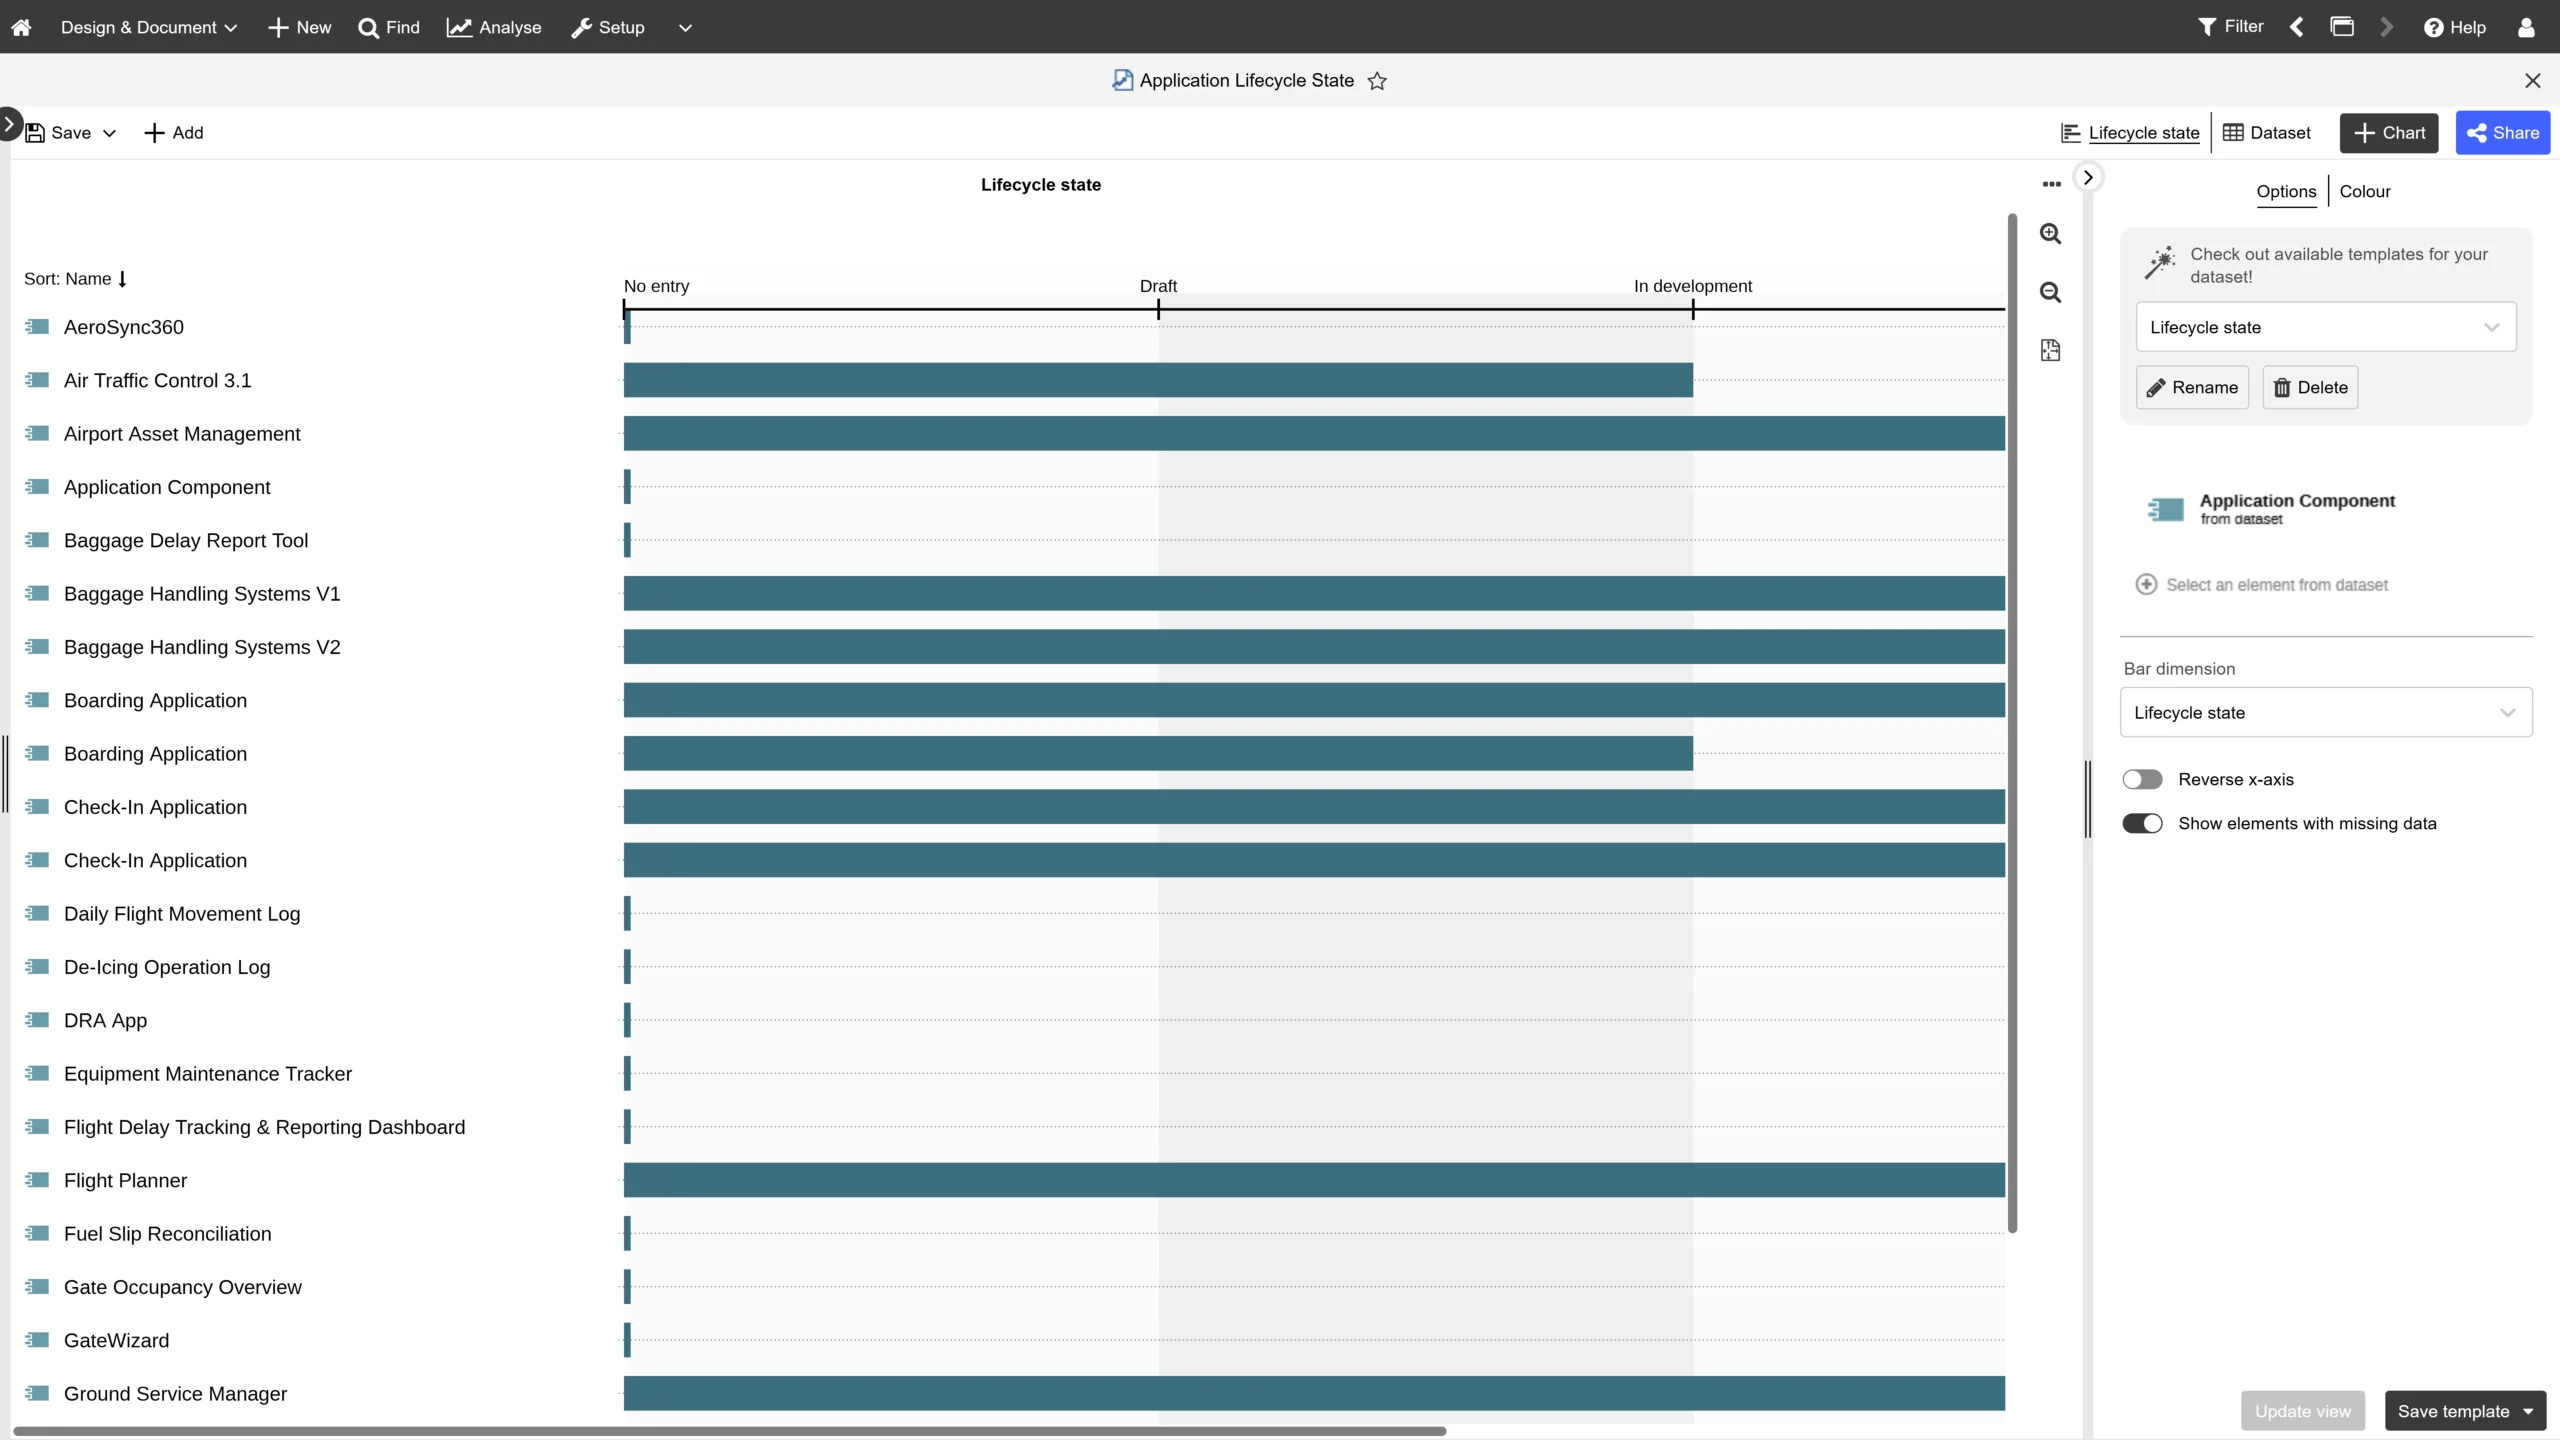
Application lifecycle monitoring in ADOIT
Bringing It All Together: From Metrics to Action
The metrics we mentioned are useful on their own. Combined, they provide a holistic view of portfolio health.
For example:
- High cost + low usage → strong candidate for retirement
- High business value + poor health → prioritize modernization
- Low fitness + high risk → consider replacement
The real value of APM comes from combining these insights to support smarter investment decisions.
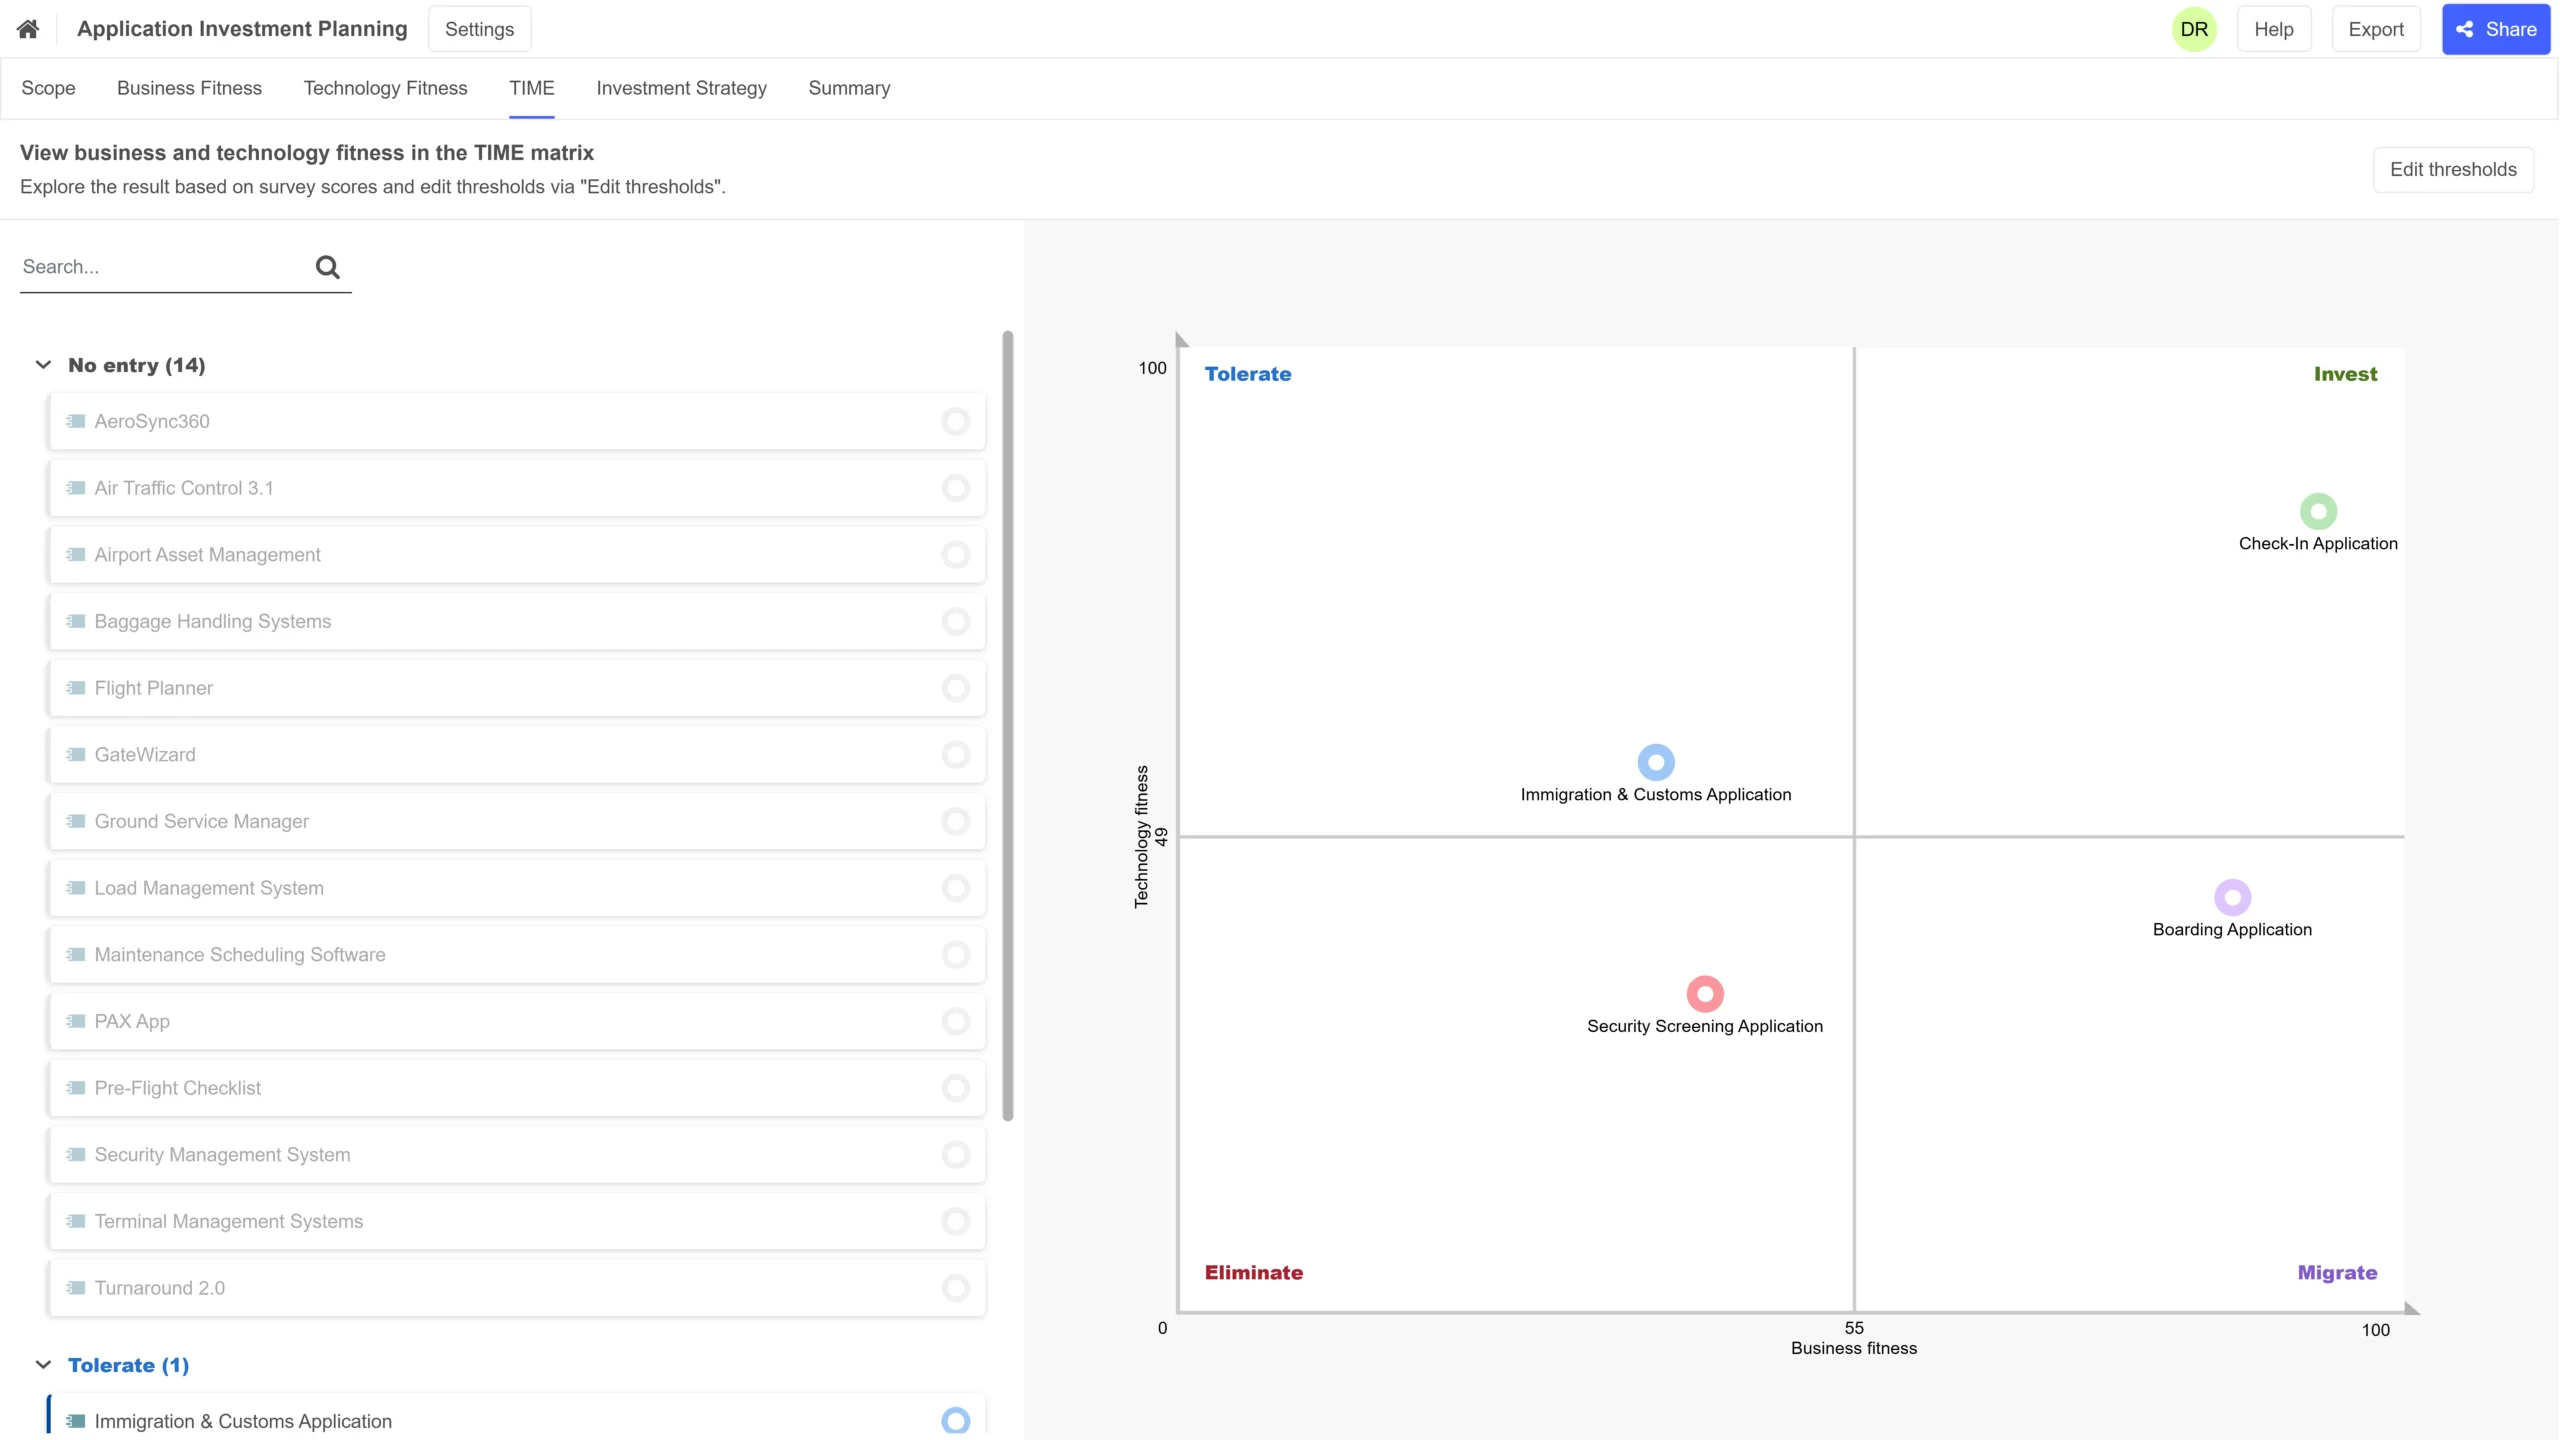
Support smarter investment decisions with TIME Model in ADOIT
Common Pitfalls When Measuring APM Success
Even with the right KPIs, organizations often struggle due to:
Focusing on cost alone:
Cost reduction is important, but ignoring business value leads to poor decisions.
Inconsistent data collection:
Unstructured or subjective data undermines KPI reliability.
Lack of visualization:
If stakeholders can't easily interpret the data, it won't drive action.
One-time measurement:
APM is not a one-off exercise. Metrics must be tracked continuously.
How to Operationalize APM Metrics in Practice
To make these KPIs actionable, standardize how data is collected across teams and automate the scoring and calculations wherever you can. Dashboards and visual models then help you communicate insights to stakeholders, while the metrics feed directly into governance and decision-making.
Modern Enterprise Architecture tools like ADOIT simplify much of this by linking data and analysis with visualization in one central place.
Summary: Measure What Matters
A healthy application portfolio doesn’t happen by accident. It’s the result of continuous measurement and informed action.
The right APM metrics increase transparency across business and IT while cutting unnecessary costs and risks. They also keep applications aligned with strategic goals and give you the foundation for proactive, data-driven decisions.


Already got our weekly updates?