")

Found this helpful? Share it with peers.
Introduction
Embarking on a voyage of business transformation requires a fresh perspective, an innovative approach that transcends the conventional. Just as a caravan gathers people together around a journey or a shared idea, our metaphorical caravan represents the stakeholders of an organization, united in their quest for growth and innovation. But how do you ensure the success of the caravan’s journey?
In this blog post – inspired by Cecilia Nordén’s book*, “The Milky Way” – we will discuss how to leverage the idea of the Milky Way map with ArchiMate modelling notation, the most comprehensive and expressive enterprise architecture (EA) modelling language. Drawing inspiration from the cosmos, this map reveals the intricate connections, processes, and interdependencies that shape an enterprise, presenting an entire organization on a single page.
Keep reading to explore this extraordinary approach, empowering you to understand, strategize, and accelerate decision-making, while embracing and fueling business transformation.
What is a Milky Way enterprise map?
The Milky Way map is an approach to analysing and visualizing an entire organization on a single page. It is based on the fact that people tend to comprehend and interpret visual maps better than other forms of representation, such as plain text or tables.
The map can be a one-pager that everyone in an organization can understand, including executives, managers and staff. It uses common concepts such as value streams, business processes and application components, that everyone in the organization is familiar with.
Why do you need a Milky Way enterprise map?
The Milky Way map helps to visualize important aspects of your business and allows stakeholders to address key areas. It is used by team members to grasp and communicate the big picture, ensuring everyone involved is on the same page.
Hence, it serves to improve common understanding. It creates shared knowledge and facilitates faster decision-making. Using a Milky Way map as a starting point, your stakeholders can add various information perspectives and collaborate to combine business value, value flows, organizational information, business processes, and IT perspectives.


Henry David Thoreau
The same holds true for you and your colleagues. By increasing your understanding of the essential connections across the organization, you can identify synergies and find brothers-in-arms for necessary business transformations.
It creates a shared understanding that even if the stakeholders involved have different goals in mind, they are not acting alone. They will start to recognize that all topics are interlaced with one another. Important links become easy to explain. The effects of change become evident.
What are the main components of a Milky Way enterprise map?
At the centre of a Milky Way map we define the main value flow. We describe the business as a cycle. Because that’s exactly what it is. The cycle which shows that activities are performed over and over again. Each of the main value flow steps forms a ‘slice of pie’, a segment in the map. Within each of the segments, you’ll find the capabilities that are important to the specific value flow at hand.
These are in turn are realized through business processes and application components.
An ArchiMate Milky Way map typically consists of elements such as capabilities, business process and application components — similar to how a technology radar visualizes the technology landscape of an organization. Depending on the focus, it can also contain other elements such as business objects or business services.
Capabilities
Capabilities are used to describe the capabilities of an organization, i.e., what it can do. The capability therefore does not explain the ‘how’.
We use capabilities as a container for everything that’s required to be able to perform the tasks of the main value flows.
Within capabilities, we describe the essential resources that are necessary for the capabilities to be realized. There are many approaches to this. Elements that we find in many Milky Ways are processes and applications.
Business processes
They describe how a company does things. Business processes are a collection of activities that, when performed by people or systems in a structured manner, produce an outcome that contributes to the company’s business goals.
Applications components
These are IT systems that support value streams and business functions.
If you are more concerned with the logical modelling of IT systems, you can use application services instead of application components.
An example of a Milky Way map
A part of a Milky Way map of an airport may look like the graphic below.
P.S. This graphic shows only a snippet of a Milky Way map.
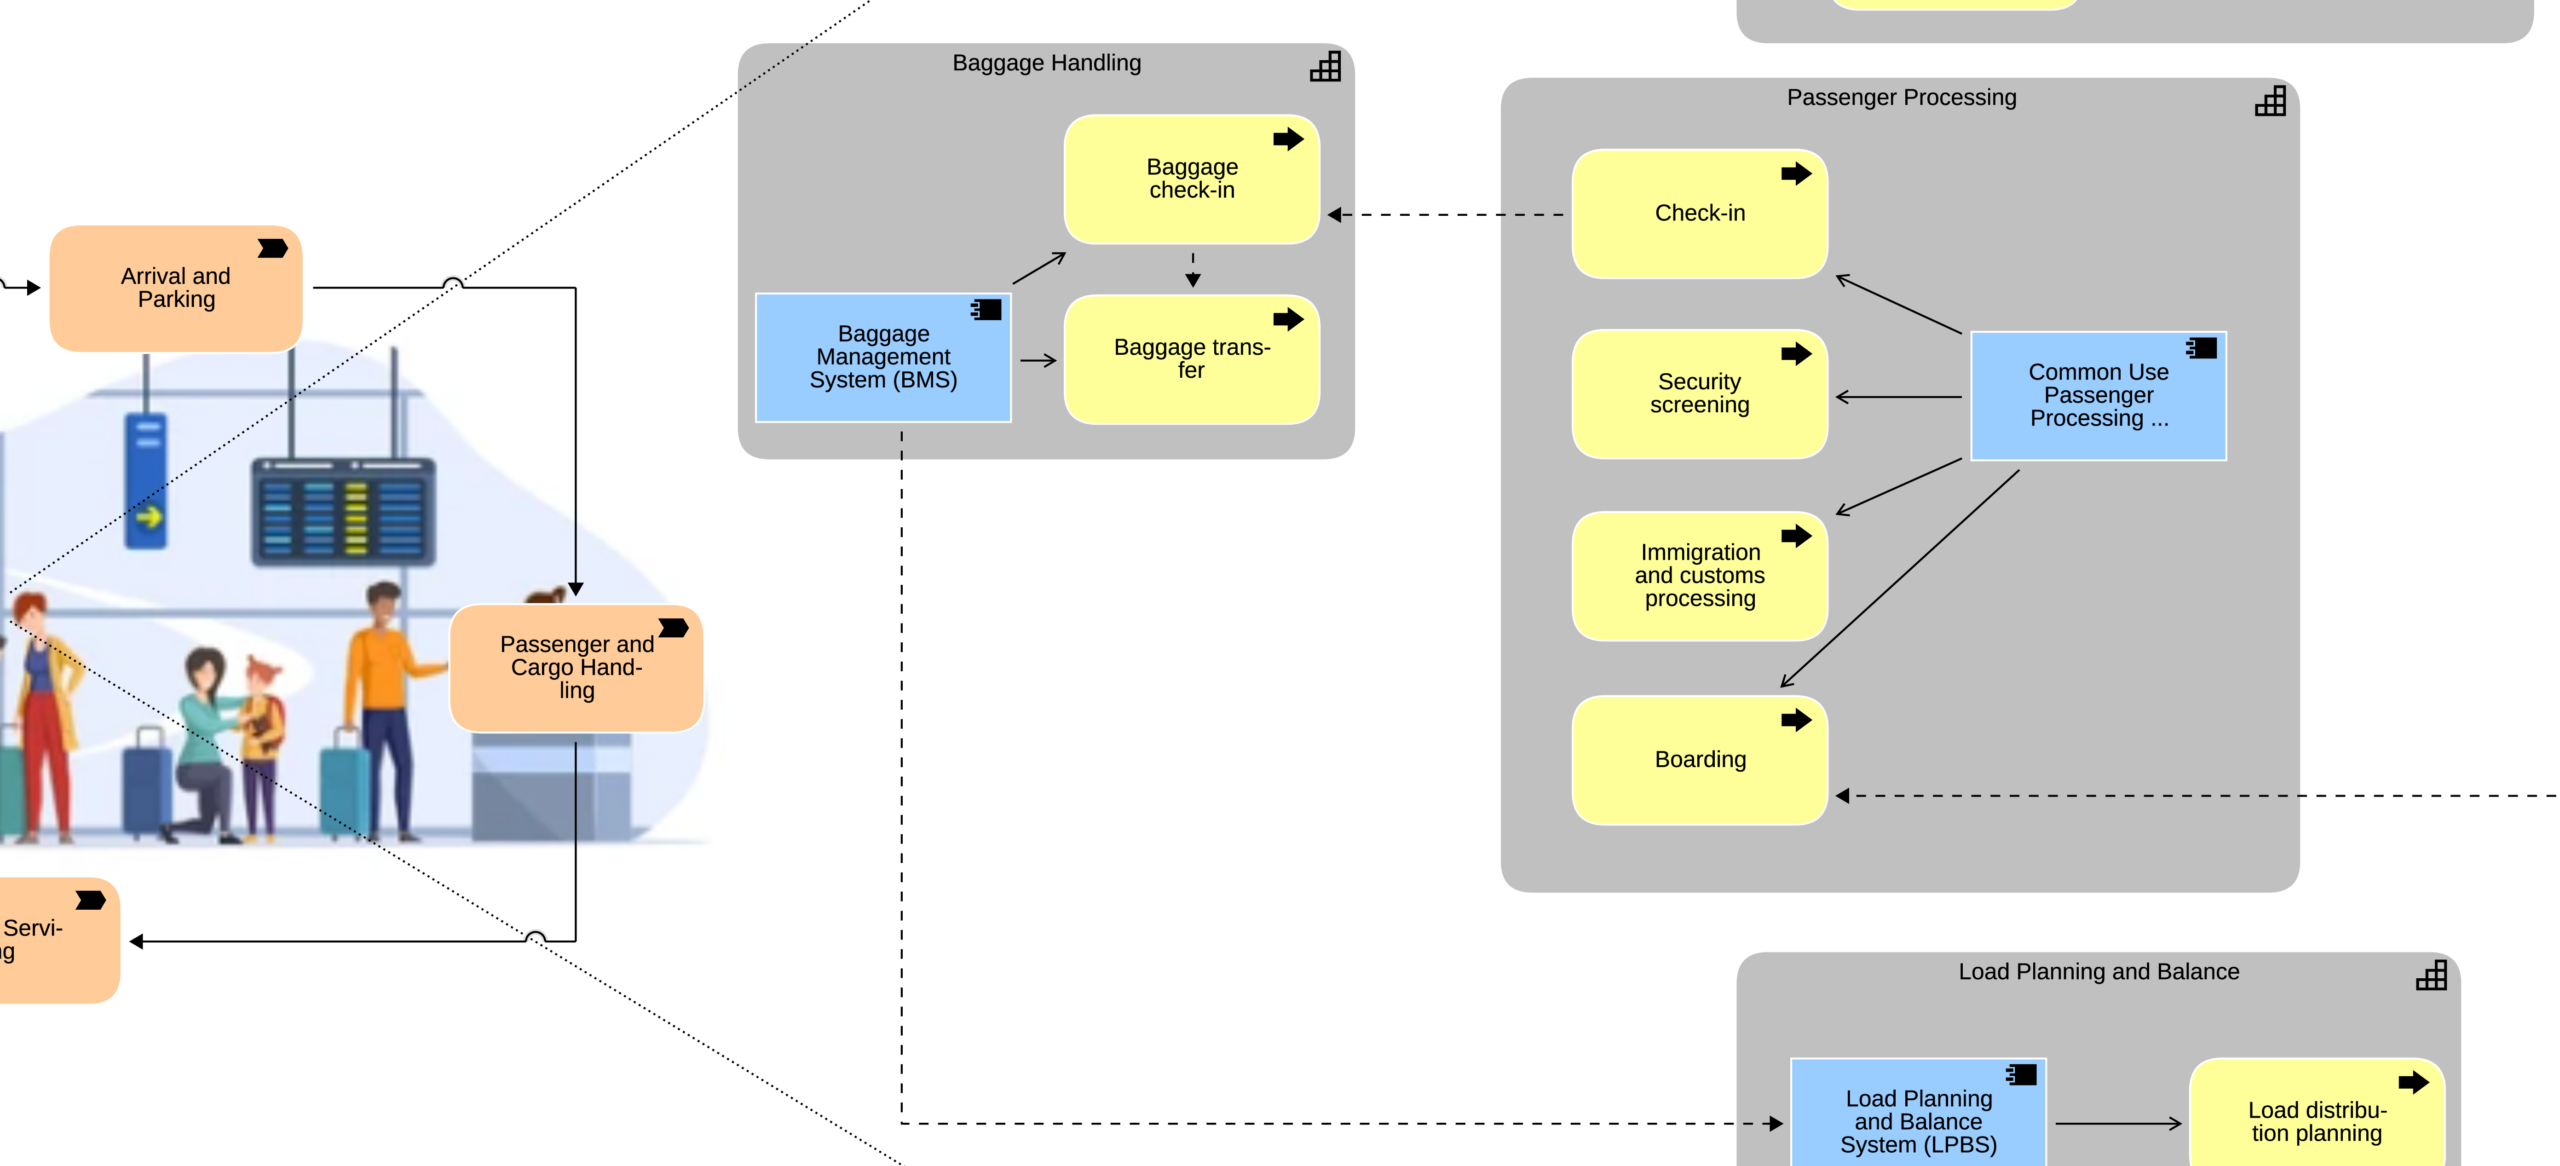
A snippet of an ArchiMate-based view of an airport
It shows the main value stream step “Passenger and Cargo Handling” and some of its serving capabilities, namely “Baggage Handling” and “Passenger Processing”.
Hint: For a full illustration of practical tips, download our Milky Way Map free cheatsheet.
Milky Way Maps in practice
How to create a Milky Way Map?
In order to create a Milky Way Map, follow these five steps:
- Identify the main steps in the value flow
- Make rough divisions within sectors
- Capture capabilities, business processes, application components
- Connect the elements using the relation “Information Flow”
- Review the map and seek acceptance
Please note: Do not map too much detail from the start. Details can be added later in your workshops and depending on the task.
How to navigate a Milky Way Map?
Your Milky Way map can now be used as a foundation to create overlays with more rapidly changing information, helping to make sense of how everything interacts. Typical questions you might ask:
- Which areas of our company will be affected by a new strategy?
- On what areas do we spend our money?
- Where do we need better IT support?
- Where do we face sustainability issues?
- Where do have problems like bottlenecks, security issues or lack of information?
- Where do we have risks?
- What customer journeys do we have?
Findings are typically annotated in the form of assessments and form the basis for the creation of roadmaps. Best practices for creating and managing such roadmaps can be found in our Strategic Roadmapping blog post.
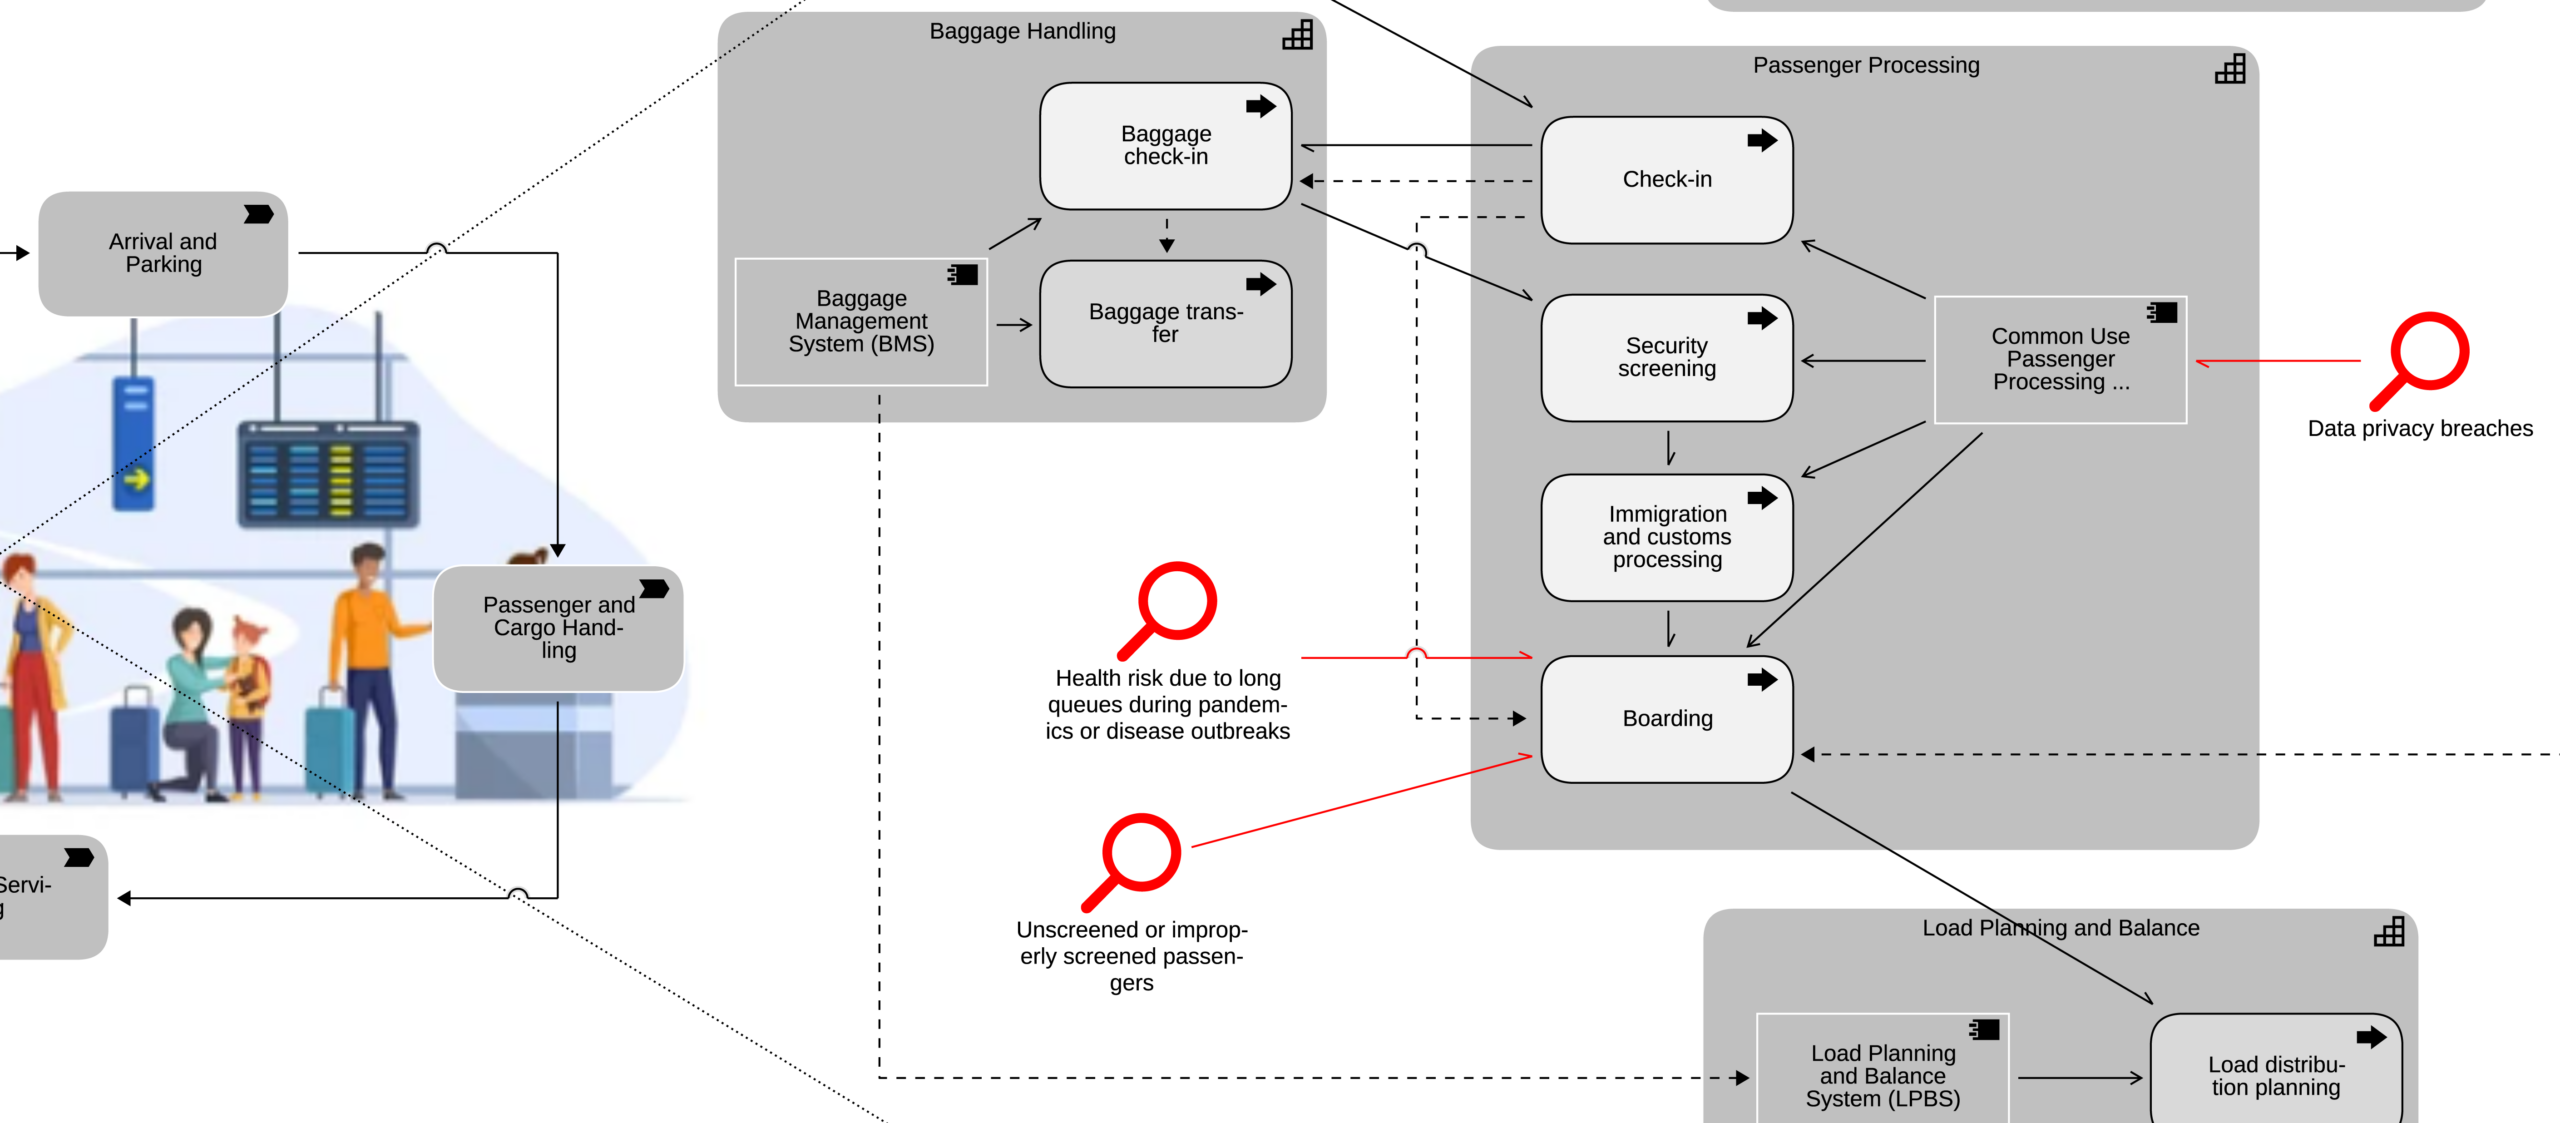
Snippet of a Milky Way view of an airport, in which some elements are assigned risks and/or opportunities
Heatmaps are another popular method of navigating Milky Way maps, using color codes to highlight important details of the Milky Way map. In the example below, we see the application components color-coded according to their TIME status (Tolerate, Invest, Migrate, Eliminate). Learn more about TIME in this blog post about Application portfolio strategy.
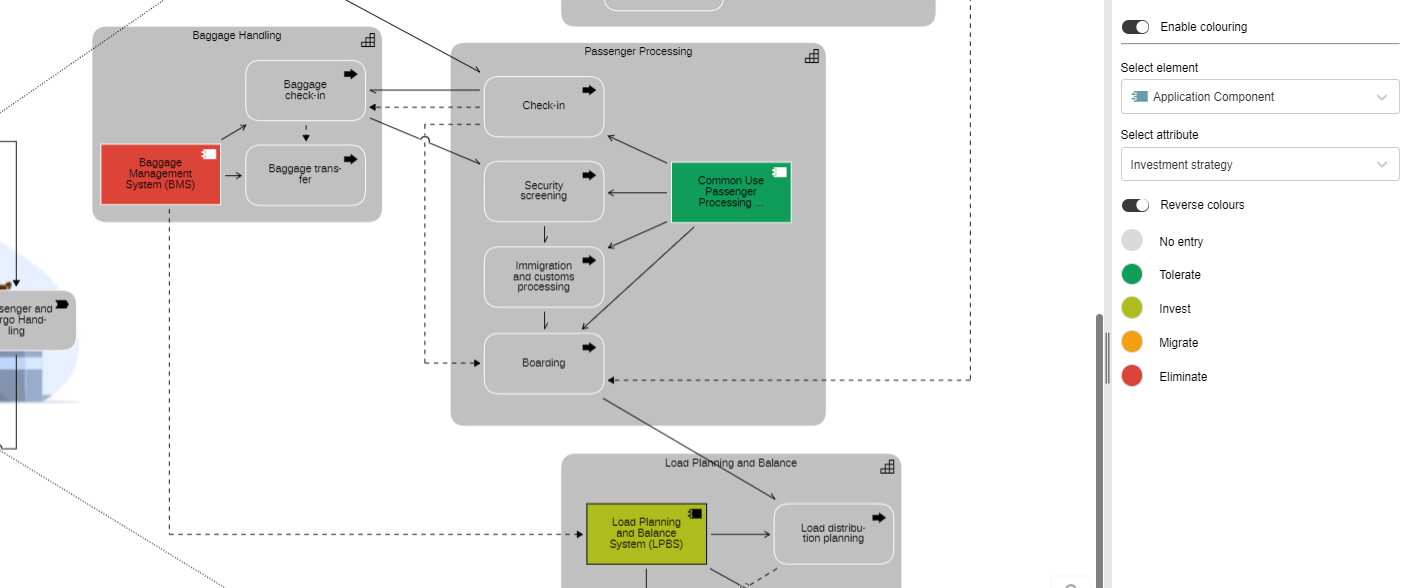
Snippet of a Milky Way view of an airport showing application components in terms of their TIME investment strategy as a heat map
Another great use case is the mapping and analysis of the customer journey. Customer journey analysis puts the company directly into the mind of the consumer. You will better understand your customers’ processes, needs, and perceptions. At the same time, you will better understand how the customer journeys are supported in the backend.
In the case of an airport, you might be interested in the journey from the passenger’s point of view, from booking a flight, through departure, to the destination. For this purpose, you model the touchpoints with the customer and show how they are integrated into the overall value flow of the airport.
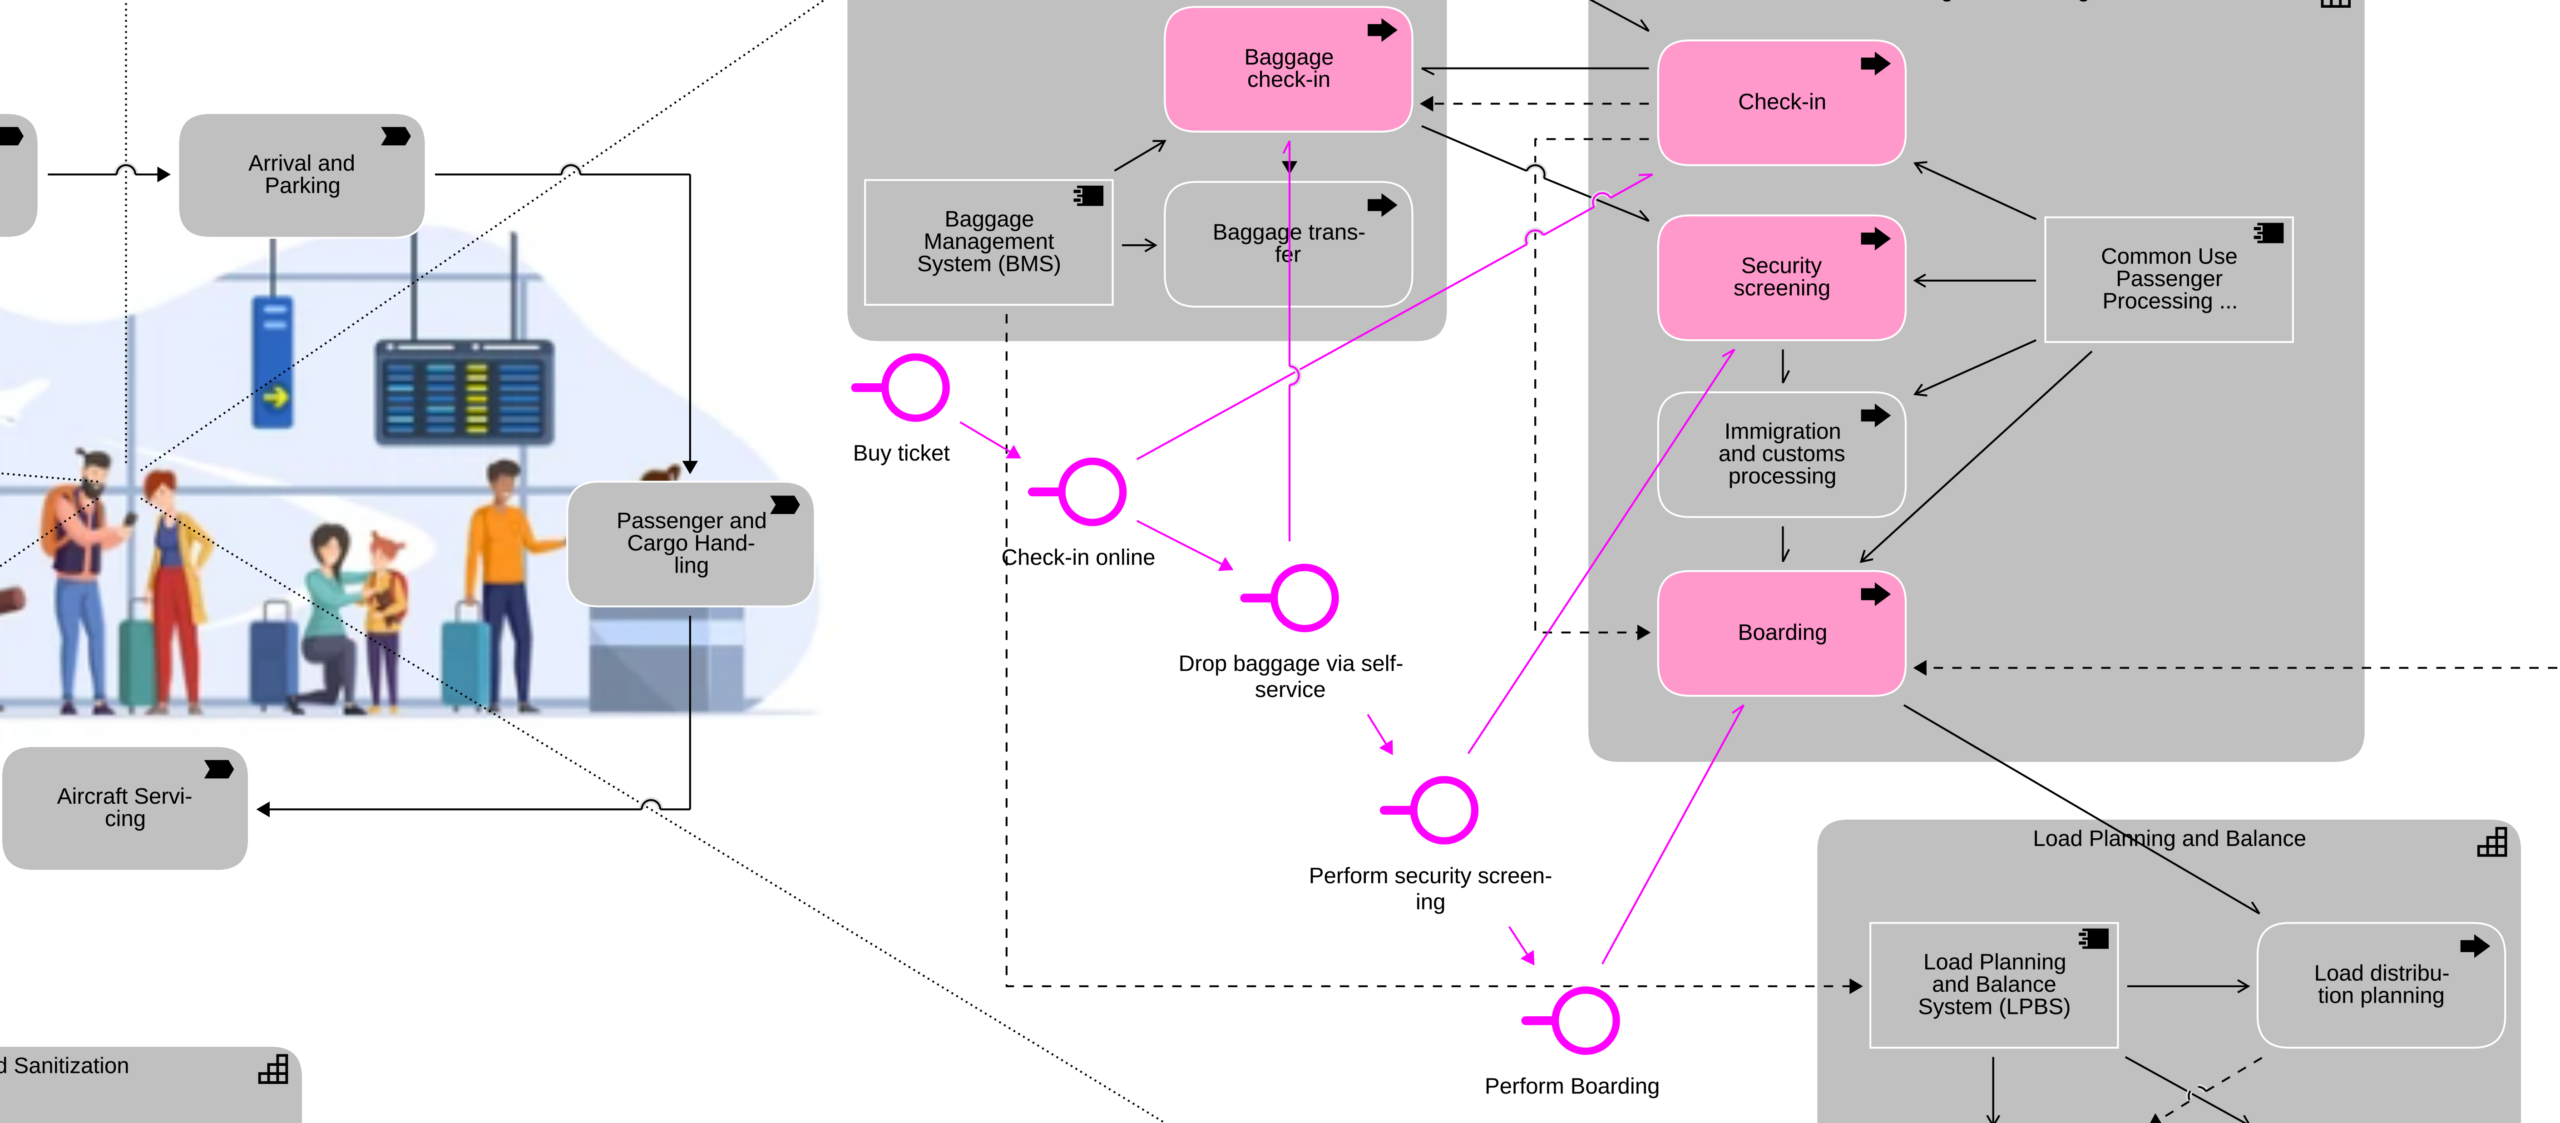
Snippet of a Milky Way view of an airport, highlighting all the customer touchpoints during a domestic flight
Summary
The use of Milky Way maps for enterprise mapping can be a powerful tool for organizations, as it represents the business as a cycle rather than a linear structure seen in traditional process maps. This approach helps to illuminate feedback loops, among other things, and is easy for all team members to understand.
And in order to make your Milky Way map in the most efficient and painless way, we strongly recommend relying on dedicated tool support. Our EA suite ADOIT powered by ArchiMate modelling language is a great option to get your mapping done quickly and easily.
Try out our EA suite for free today and empower everyone in your organization to grasp the same big picture and work towards a shared goal.


Already got our weekly updates?