Governance, Risk & Compliance
Found this helpful? Share it with peers.
From Reporting to Active Risk Management: How LLB Connects Risks, Controls and Incidents
By connecting risks, controls, processes and incidents, LLB has cut the effort for typical risk analyses by around 90 percent and laid the foundation for active risk management.
When Risk Reporting Becomes a Workload of Its Own
Before the project, the information Liechtensteinische Landesbank (LLB) needed for risk reporting was spread across separate registers, with risks, controls and incidents each held in a different data source. For every analysis, employees had to pull the relevant information, combine it in Excel, reformat it and rebuild it into tables and charts.
LLB produced standard reports every quarter and also handled ad hoc requests from audit, supervisory authorities and the wider organization. On average, an update was needed about once a month. These recurring manual steps were time-consuming and error-prone, and they made reporting dependent on the employees who knew the different data sources.
But LLB wanted more than faster numbers. It wanted to make better use of its data so it could assess and manage risks on a sounder basis.
“We increasingly realized that processes, risks, controls and incidents should not be viewed in isolation.” – Christoph Hämmerle, Head of Group Operational Risk at LLB
It’s only when this information is linked that you can check a risk assessment against reality: Which losses have actually occurred? Which controls address a given risk? Are they effective? And where would additional actions make sense?
Managing Risks Better Instead of Reporting Faster
So the goal went beyond automating existing reports. LLB wanted a common foundation across the group that would connect risks, controls, incidents and processes and put the available information to better use in risk decisions.
This also changed the role of reporting. Rather than pulling data together for each periodic report, LLB wanted it available as a current basis for managing risk.
LLB worked toward this goal step by step.
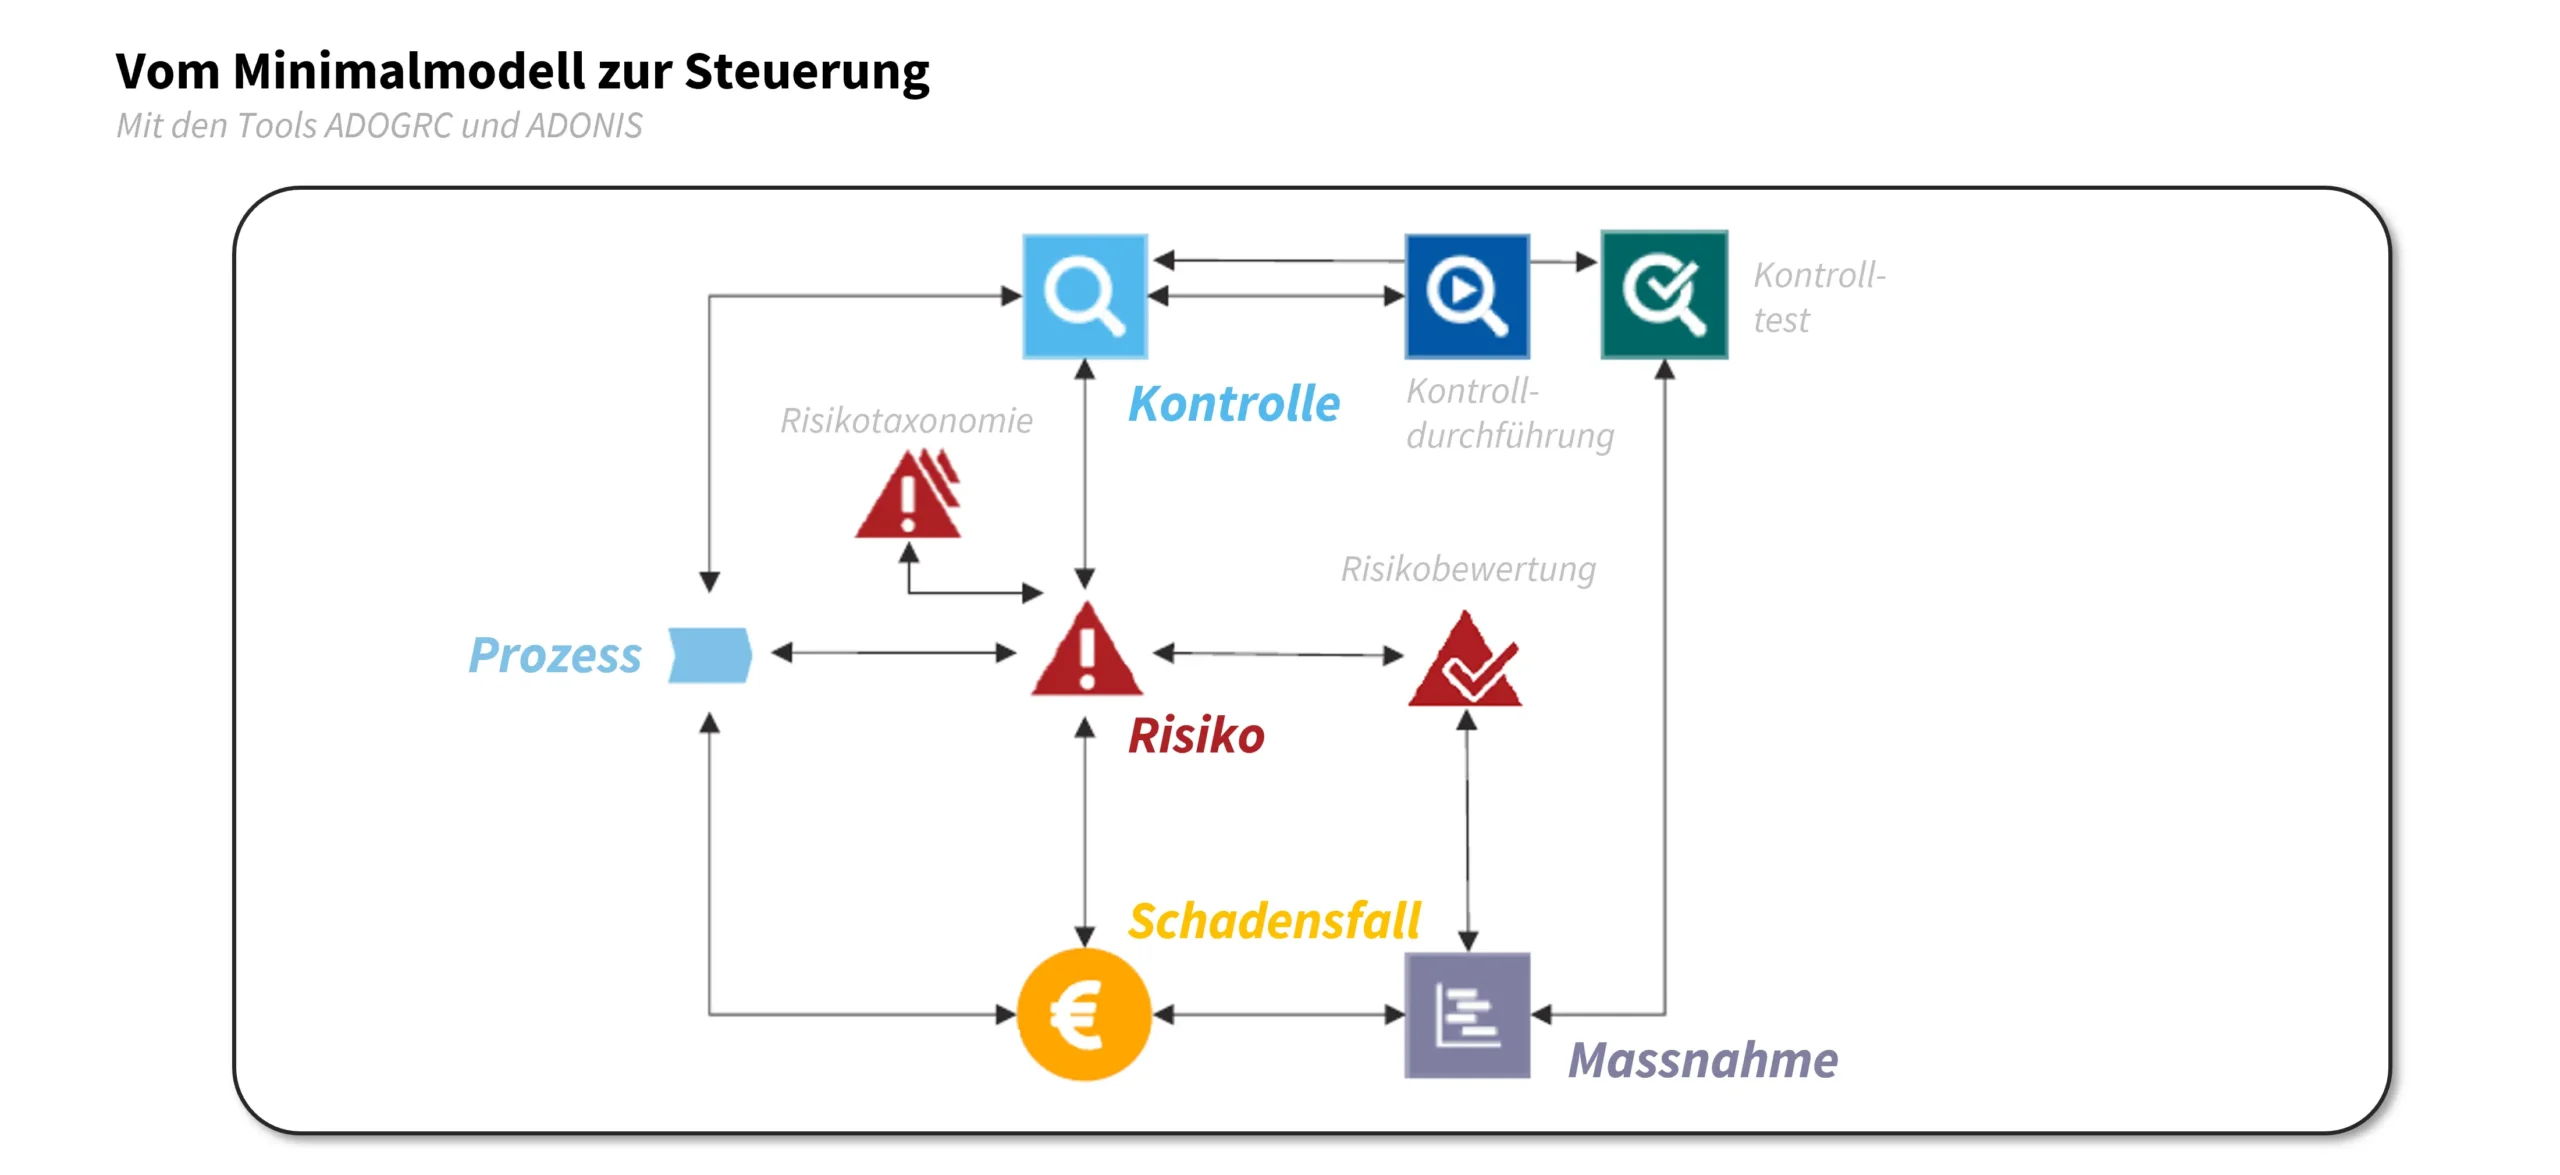
Starting with the essentials
One key methodological decision was to avoid moving as much information as possible into the new model. Instead, LLB started from the specific questions it needed to answer to manage risk:
What data and relationships do we absolutely need to meet our requirements and answer the relevant questions?
The answer was a lean, minimal model containing only the necessary fields and relationships, which can be expanded step by step later on. This kept complexity down and created a common standard.
Connecting risks, controls and incidents
The model’s core elements are risks and the risk taxonomy, controls and their effectiveness assessments, and incidents, processes and actions.
What matters most is how these elements are linked. The links make it possible to trace, for example, which controls address specific risks, whether incidents still occur despite those controls, and in which processes losses are concentrated.
These connections are what allow LLB to check risk assessments against actual events and pinpoint more precisely where action is needed.
Ensuring data quality before analysis
For these relationships to hold up in analysis, LLB starts at data entry. Mandatory fields, defined process steps and checks make sure the required information is complete, and only completed, verified records go into final reporting. Data quality is built into the underlying process rather than addressed at the reporting stage.
Automated data transfer to reporting
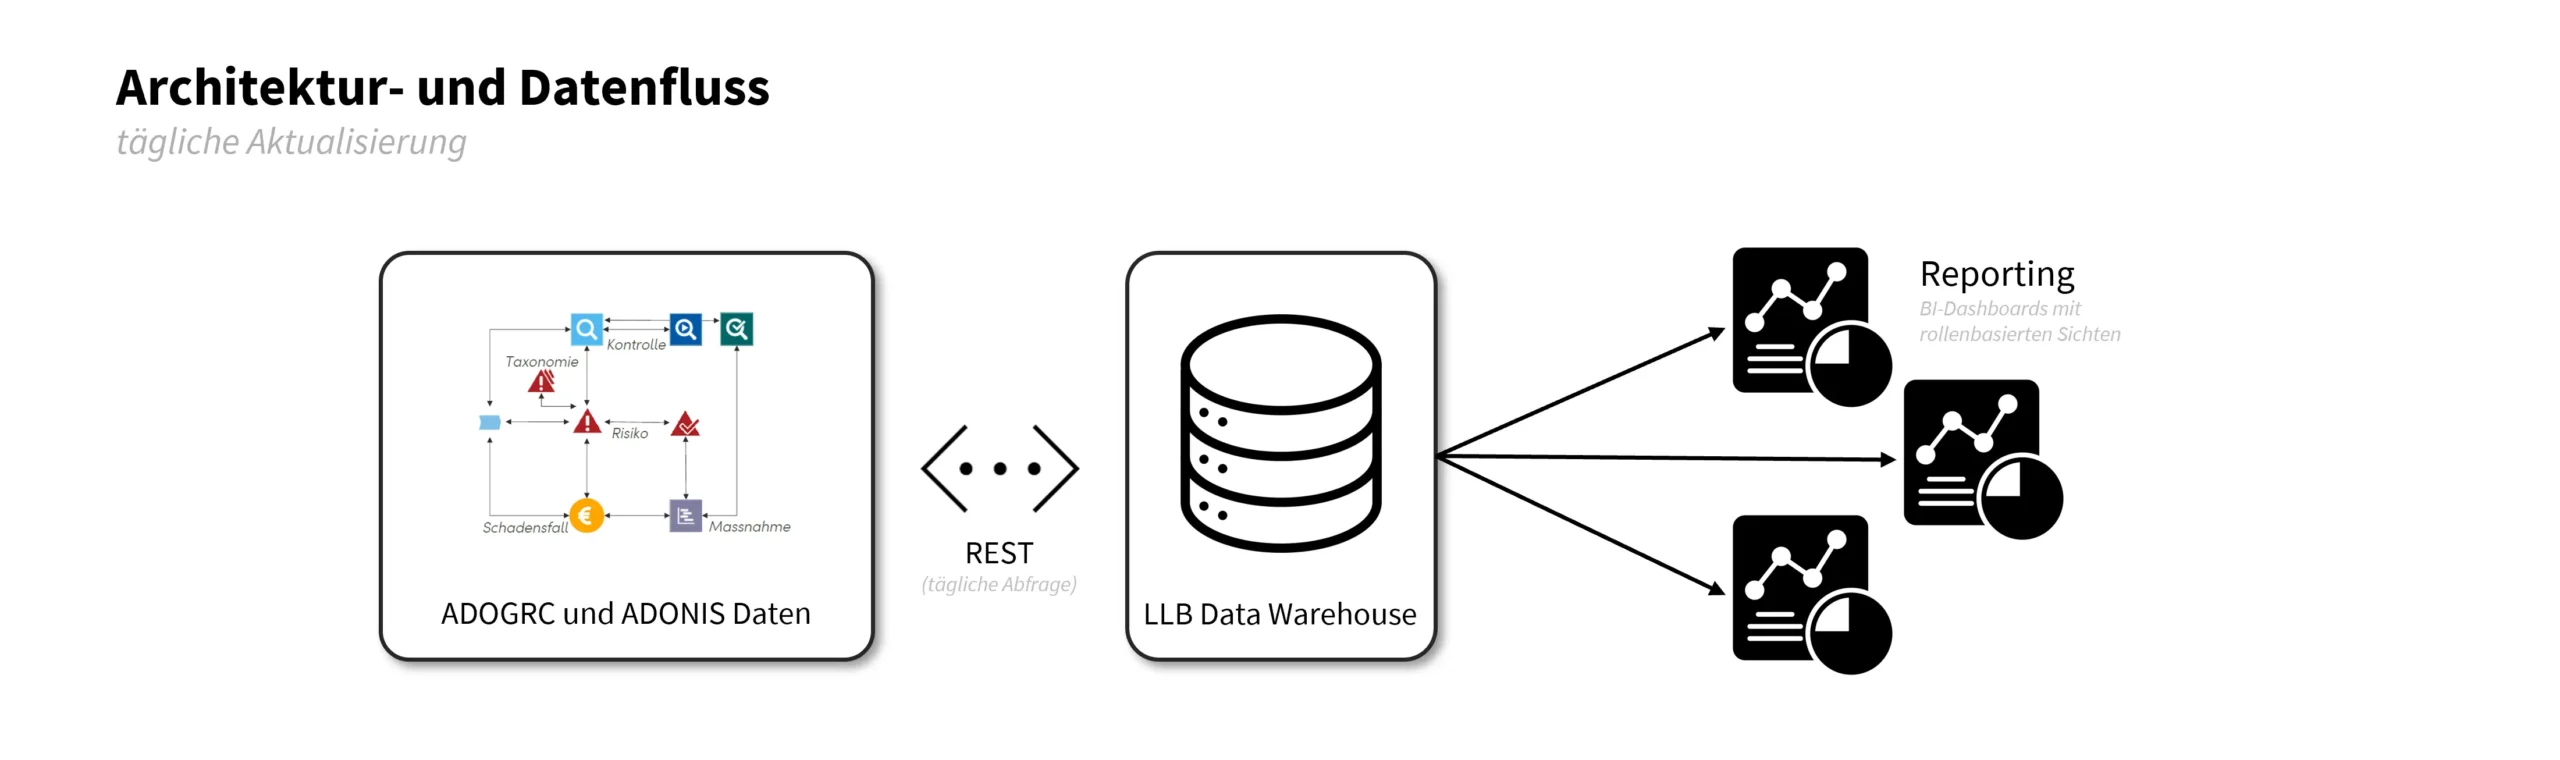
LLB runs its operational data foundation on ADOGRC and ADONIS from BOC Group. Once a day, a REST API transfers the relevant data to LLB’s data warehouse, where it is prepared and displayed in BI dashboards.
The repeated manual work of consolidating data is gone, and risk management now runs on information that is updated daily.
Role-based views on a need-to-know basis
Not all risk information is meant for everyone, so LLB uses a role- and responsibility-based access model that follows the need-to-know principle.
Division heads see the risks, controls and incidents relevant to their own area, while central functions such as Risk or Audit can work with group-wide views. Everyone draws on the same data, and the access model determines what each person can see based on their area of responsibility.
Step by step, this turns the shared data model into exactly what LLB set out to build: a reliable information base for day-to-day risk management, tailored to each audience.
The Biggest Challenge Wasn’t the Dashboard
The project took around two years. LLB’s core team of around five people from risk management and IT worked on it with support from BOC Group.
Key stages included tool evaluation, solution design, data preparation and migration, building the data model, quality assurance, training and operationalization.
Christoph Hämmerle says the migration and the conceptual work were particularly demanding. The team had to prepare the existing risk, control and incident registers, with several thousand data fields between them, and migrate them into the new structure. At the same time, existing mappings and processes had to be reviewed, and some of them rethought.
That made the project far more than a technical rollout. LLB also had to change established ways of working and win over different stakeholders to the shared approach.
“At the start, it’s worth investing time in persuading people and bringing those affected on board early.” – Christoph Hämmerle


90 Percent Less Effort and More Time for Risk Management
The clearest measurable impact is on typical risk analyses. Hämmerle puts the reduction in effort at around 90 percent:

Christoph Hämmerle,
Head of Group Operational Risk,
Liechtensteinische Landesbank AG
The benefits go beyond time savings. Division heads can now see for themselves how the controls in their area are performing and where action is needed, so they can respond earlier, before the second line needs to get involved.
Usage shows that the risk information has reached the wider organization. The dashboard gets several hundred views per quarter, and beyond the risk teams, it is used by audit, division heads and decentralized risk units.
How Transparency Helps Reduce Incidents
The shift to active risk management is especially clear with operational incidents.
With the data connected, LLB can more easily see which processes and areas have clusters of losses. It then works with the affected areas to investigate the causes, define improvement actions and adjust processes, and the reporting shows how incidents develop afterward.
“We saw where the clusters were, took concrete action there, and can now see in our reporting that incidents in those areas are going down.” – Christoph Hämmerle
This closes the loop:
Connect data → Spot anomalies → Analyze causes → Take action → Monitor impact
Reporting now does more than document what happened. It helps LLB identify where action is needed and see what effect its actions are having.
And that is exactly what the step from reporting to active risk management means.
The Effort Pays Off, and the Foundation Keeps Growing
The project has made LLB’s risk reporting more efficient, and it has given the bank a shared data foundation that further use cases can build on.
“Getting to modern risk management with a shared data model and the right GRC solution takes a lot of effort. But looking back, we can say clearly that the effort is worth it.” – Christoph Hämmerle
LLB now plans to extend the data foundation to other resilience topics, including DORA, the FINMA circular on operational risk management, business continuity management and third-party service provider monitoring.
The bank also wants to link critical functions, business-critical processes, applications, service providers and infrastructure components more closely, so that when an incident occurs, it is easier to see which dependencies exist and where the impact may be felt.
The approach stays the same: make connections visible and use existing information in a targeted way to understand risks better and manage them on a more informed basis.